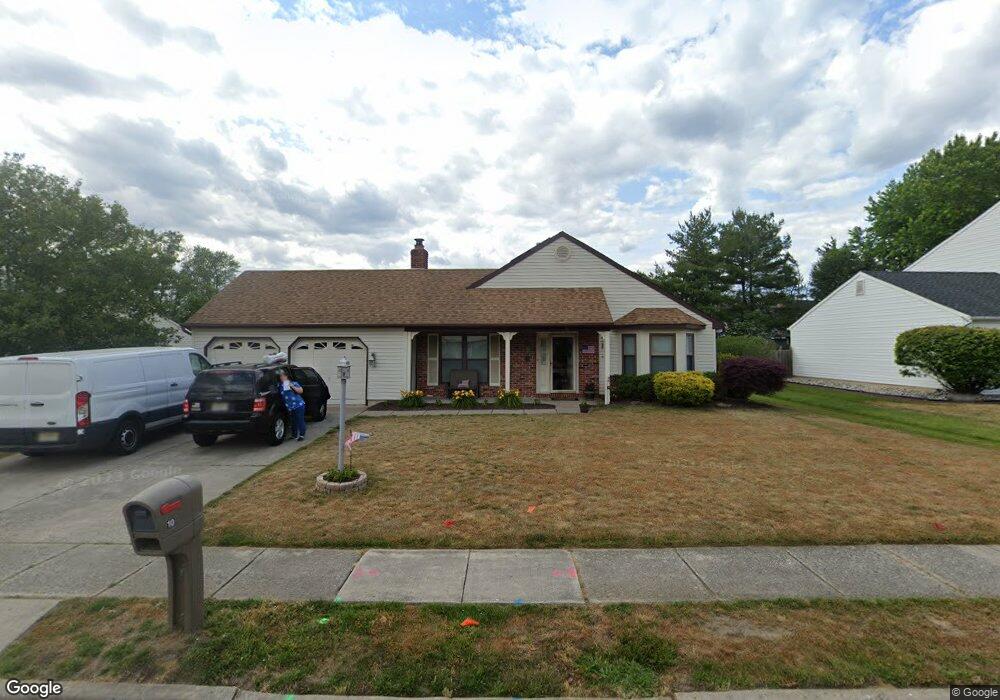
10 S Mars Dr Sewell, NJ 08080
Washington Township NeighborhoodEstimated Value: $351,793 - $386,000
3
Beds
2
Baths
1,303
Sq Ft
$283/Sq Ft
Est. Value
About This Home
This home is located at 10 S Mars Dr, Sewell, NJ 08080 and is currently estimated at $368,448, approximately $282 per square foot. 10 S Mars Dr is a home located in Gloucester County with nearby schools including Washington Township High School, Thomas Jefferson Elementary School, and Orchard Valley Middle School.
Ownership History
Date
Name
Owned For
Owner Type
Purchase Details
Closed on
Aug 31, 2011
Sold by
Cardillo Rose
Bought by
Rossi Kenneth W and Rossi Debra M
Current Estimated Value
Home Financials for this Owner
Home Financials are based on the most recent Mortgage that was taken out on this home.
Original Mortgage
$149,985
Outstanding Balance
$104,265
Interest Rate
4.58%
Mortgage Type
FHA
Estimated Equity
$264,183
Create a Home Valuation Report for This Property
The Home Valuation Report is an in-depth analysis detailing your home's value as well as a comparison with similar homes in the area
Home Values in the Area
Average Home Value in this Area
Purchase History
| Date | Buyer | Sale Price | Title Company |
|---|---|---|---|
| Rossi Kenneth W | $165,000 | Old Republic National Title |
Source: Public Records
Mortgage History
| Date | Status | Borrower | Loan Amount |
|---|---|---|---|
| Open | Rossi Kenneth W | $149,985 |
Source: Public Records
Tax History Compared to Growth
Tax History
| Year | Tax Paid | Tax Assessment Tax Assessment Total Assessment is a certain percentage of the fair market value that is determined by local assessors to be the total taxable value of land and additions on the property. | Land | Improvement |
|---|---|---|---|---|
| 2025 | $6,980 | $188,700 | $57,600 | $131,100 |
| 2024 | $6,784 | $188,700 | $57,600 | $131,100 |
| 2023 | $6,784 | $188,700 | $57,600 | $131,100 |
| 2022 | $6,561 | $188,700 | $57,600 | $131,100 |
| 2021 | $4,544 | $188,700 | $57,600 | $131,100 |
| 2020 | $6,380 | $188,700 | $57,600 | $131,100 |
| 2019 | $5,912 | $162,200 | $37,600 | $124,600 |
| 2018 | $5,846 | $162,200 | $37,600 | $124,600 |
| 2017 | $5,773 | $162,200 | $37,600 | $124,600 |
| 2016 | $5,739 | $162,200 | $37,600 | $124,600 |
| 2015 | $5,658 | $162,200 | $37,600 | $124,600 |
| 2014 | $5,479 | $162,200 | $37,600 | $124,600 |
Source: Public Records
Map
Nearby Homes
- 19 S Mars Dr
- 10 Menkar Ave
- 19 Intrepid Dr
- 19 Mariner Dr
- 219 Loring Ct Unit 219
- 209 Loring Ct Unit 209
- 7 Halley Ln
- 36 Jupiter Dr
- 616 Covington Ct Unit 616
- 319 Georgia Ct
- 1 Quail Hollow Dr
- 509 Cascade Ct Unit 509
- 66 Haddock Dr
- 434 Atlanta Ct Unit 434
- 76 Lupus Ln
- 54 Libra Ln
- 50 Fomalhaut Ave
- 192 Altair Dr
- 0 Pitman Downer Rd
- 4 Corvas Ct