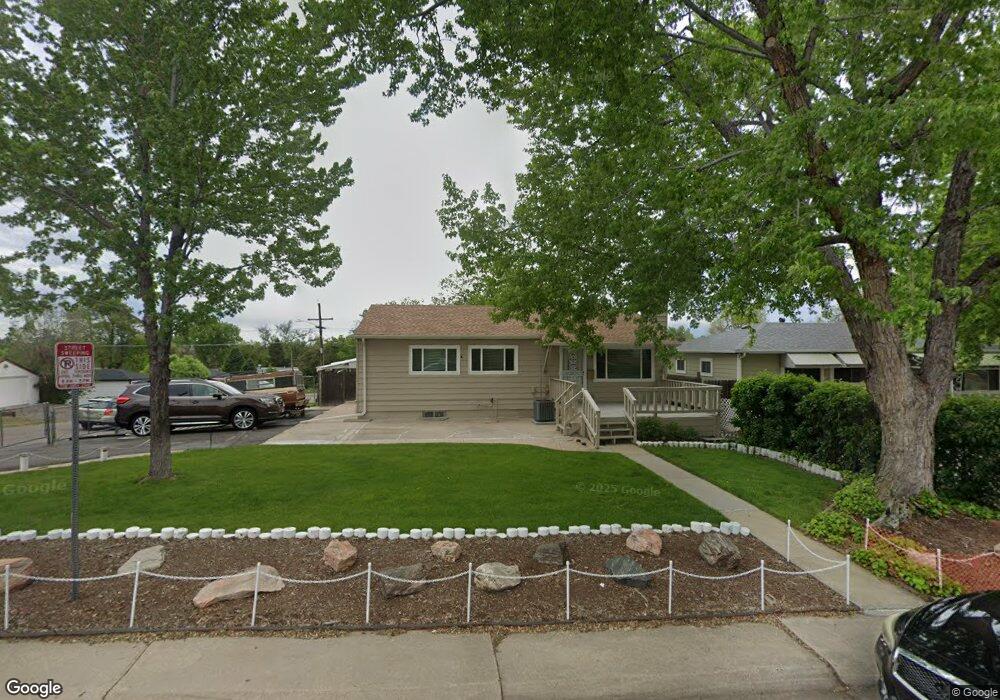
10 S Vrain St Denver, CO 80219
Barnum NeighborhoodEstimated Value: $389,178 - $468,000
3
Beds
1
Bath
994
Sq Ft
$440/Sq Ft
Est. Value
About This Home
This home is located at 10 S Vrain St, Denver, CO 80219 and is currently estimated at $437,545, approximately $440 per square foot. 10 S Vrain St is a home located in Denver County with nearby schools including Newlon Elementary School, Kepner Beacon Middle School, and West High School.
Ownership History
Date
Name
Owned For
Owner Type
Purchase Details
Closed on
Nov 12, 1997
Sold by
Licata Kenneth R and Lynn Cheryl Lynn
Bought by
Licata Kenneth R and Licata Cheryl L
Current Estimated Value
Home Financials for this Owner
Home Financials are based on the most recent Mortgage that was taken out on this home.
Original Mortgage
$67,500
Outstanding Balance
$11,107
Interest Rate
7.31%
Estimated Equity
$426,438
Purchase Details
Closed on
Feb 28, 1995
Sold by
Licata Kenneth R and Killillay Cheryl L
Bought by
Licata Kenneth R and Licata Cheryl Lynn
Home Financials for this Owner
Home Financials are based on the most recent Mortgage that was taken out on this home.
Original Mortgage
$66,000
Interest Rate
9.19%
Purchase Details
Closed on
Dec 30, 1994
Sold by
Roybal Joe E and Roybal Evelyn L
Bought by
Licata Kenneth R and Killillay Cheryl L
Home Financials for this Owner
Home Financials are based on the most recent Mortgage that was taken out on this home.
Original Mortgage
$66,000
Interest Rate
9.19%
Create a Home Valuation Report for This Property
The Home Valuation Report is an in-depth analysis detailing your home's value as well as a comparison with similar homes in the area
Home Values in the Area
Average Home Value in this Area
Purchase History
| Date | Buyer | Sale Price | Title Company |
|---|---|---|---|
| Licata Kenneth R | -- | -- | |
| Licata Kenneth R | -- | -- | |
| Licata Kenneth R | $79,900 | -- |
Source: Public Records
Mortgage History
| Date | Status | Borrower | Loan Amount |
|---|---|---|---|
| Open | Licata Kenneth R | $67,500 | |
| Previous Owner | Licata Kenneth R | $66,000 |
Source: Public Records
Tax History Compared to Growth
Tax History
| Year | Tax Paid | Tax Assessment Tax Assessment Total Assessment is a certain percentage of the fair market value that is determined by local assessors to be the total taxable value of land and additions on the property. | Land | Improvement |
|---|---|---|---|---|
| 2024 | $1,621 | $27,160 | $4,970 | $22,190 |
| 2023 | $1,585 | $27,160 | $4,970 | $22,190 |
| 2022 | $1,052 | $20,180 | $7,190 | $12,990 |
| 2021 | $1,015 | $20,750 | $7,390 | $13,360 |
| 2020 | $1,102 | $22,000 | $6,930 | $15,070 |
| 2019 | $1,071 | $22,000 | $6,930 | $15,070 |
| 2018 | $637 | $15,440 | $6,980 | $8,460 |
| 2017 | $636 | $15,440 | $6,980 | $8,460 |
| 2016 | $1,026 | $12,580 | $4,633 | $7,947 |
| 2015 | $983 | $12,580 | $4,633 | $7,947 |
| 2014 | $693 | $8,340 | $3,088 | $5,252 |
Source: Public Records
Map
Nearby Homes
- 49 S Utica St
- 6 Utica St
- 34 S Raleigh St
- 75 Vrain St
- 40 Quitman St
- 220 S Raleigh St
- 4400 W Alameda Ave
- 274 S Quitman St
- 4200 W Alameda Ave
- 4580 W Alameda Ave
- 4582 W Alameda Ave
- 4190 W Alameda Ave
- 266 Stuart St
- 150 S Osceola St
- 3 S Newton St
- 4332 W Nevada Place
- 135 Osceola St
- 352 S Stuart St
- 200 Perry St
- 4475 W Dakota Ave