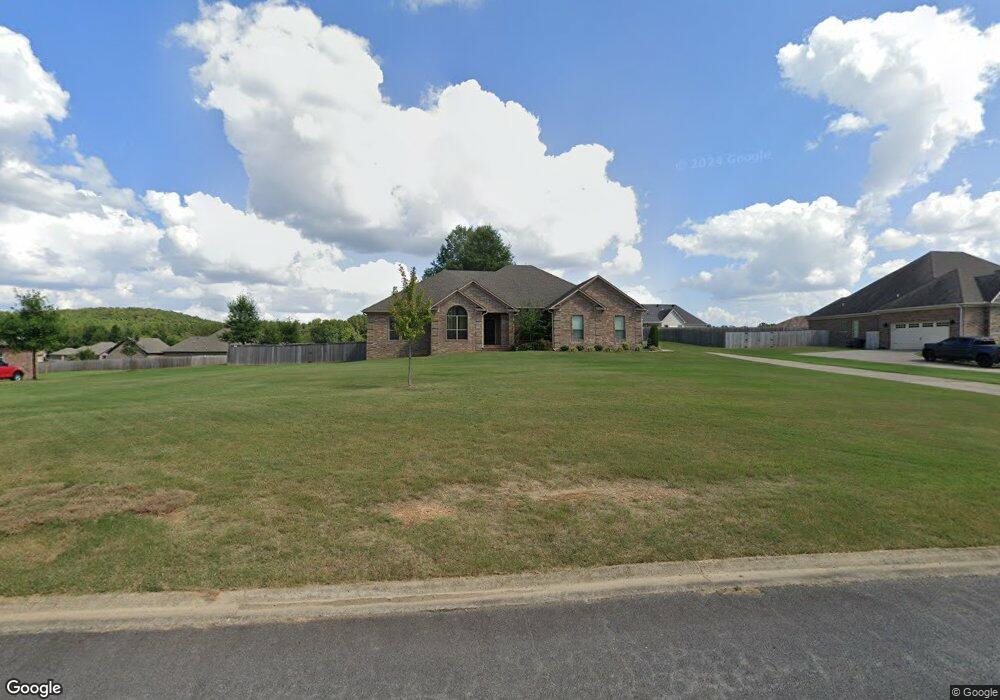
10 Sable Wood Dr Greenbrier, AR 72058
Estimated Value: $385,000 - $443,000
4
Beds
3
Baths
2,530
Sq Ft
$164/Sq Ft
Est. Value
About This Home
This home is located at 10 Sable Wood Dr, Greenbrier, AR 72058 and is currently estimated at $415,704, approximately $164 per square foot. 10 Sable Wood Dr is a home located in Faulkner County with nearby schools including Greenbrier Wooster Elementary School, Greenbrier Junior High School, and Greenbrier High School.
Ownership History
Date
Name
Owned For
Owner Type
Purchase Details
Closed on
Aug 4, 2021
Sold by
Robertson Brian and Robertson Brian E
Bought by
Robertson Brian E and Robertson Melissa
Current Estimated Value
Home Financials for this Owner
Home Financials are based on the most recent Mortgage that was taken out on this home.
Original Mortgage
$187,392
Outstanding Balance
$141,374
Interest Rate
2.2%
Mortgage Type
New Conventional
Estimated Equity
$274,330
Purchase Details
Closed on
Feb 25, 2011
Sold by
Newland Randy and New Land Construction
Bought by
Robertson Barian
Home Financials for this Owner
Home Financials are based on the most recent Mortgage that was taken out on this home.
Original Mortgage
$243,675
Interest Rate
4.78%
Mortgage Type
New Conventional
Purchase Details
Closed on
Apr 22, 2010
Sold by
Burnett Carlton and Burnett Sharon
Bought by
Newland Randy and New Land Counstruction
Create a Home Valuation Report for This Property
The Home Valuation Report is an in-depth analysis detailing your home's value as well as a comparison with similar homes in the area
Purchase History
| Date | Buyer | Sale Price | Title Company |
|---|---|---|---|
| Robertson Brian E | -- | None Available | |
| Robertson Barian | $257,000 | -- | |
| Newland Randy | $28,024 | -- |
Source: Public Records
Mortgage History
| Date | Status | Borrower | Loan Amount |
|---|---|---|---|
| Open | Robertson Brian E | $187,392 | |
| Closed | Robertson Barian | $243,675 |
Source: Public Records
Tax History
| Year | Tax Paid | Tax Assessment Tax Assessment Total Assessment is a certain percentage of the fair market value that is determined by local assessors to be the total taxable value of land and additions on the property. | Land | Improvement |
|---|---|---|---|---|
| 2025 | $3,545 | $76,380 | $6,000 | $70,380 |
| 2024 | $3,275 | $76,380 | $6,000 | $70,380 |
| 2023 | $2,977 | $57,040 | $6,000 | $51,040 |
| 2022 | $2,548 | $57,040 | $6,000 | $51,040 |
| 2021 | $2,417 | $57,040 | $6,000 | $51,040 |
| 2020 | $2,286 | $50,210 | $6,000 | $44,210 |
| 2019 | $2,286 | $50,210 | $6,000 | $44,210 |
| 2018 | $2,250 | $49,040 | $6,000 | $43,040 |
| 2017 | $2,250 | $49,040 | $6,000 | $43,040 |
| 2016 | $2,250 | $49,040 | $6,000 | $43,040 |
| 2015 | $2,348 | $47,630 | $6,000 | $41,630 |
| 2014 | $2,038 | $47,630 | $6,000 | $41,630 |
Source: Public Records
Map
Nearby Homes
- 12 Sablewood Dr
- 11 Porter Field Dr
- 9 Porter Field Rd
- 9 Sable Wood Dr
- 15 Porter Field Rd
- 4 Sablewood Dr
- 7 Sablewood Dr
- 11 Sablewood Dr
- 7 Porter Field Rd
- 7 Porter Field Dr
- 5 Sablewood Dr
- 17 Porter Field Rd
- 14 Porter Field Dr
- 16 Sable Wood Dr
- 16 Sablewood Dr
- 15 Sablewood Dr
- 12 Porter Field Rd
- 8 Porter Field Rd
- 00 Sable Wood Dr
- 17 Sable Wood Dr
Your Personal Tour Guide
Ask me questions while you tour the home.