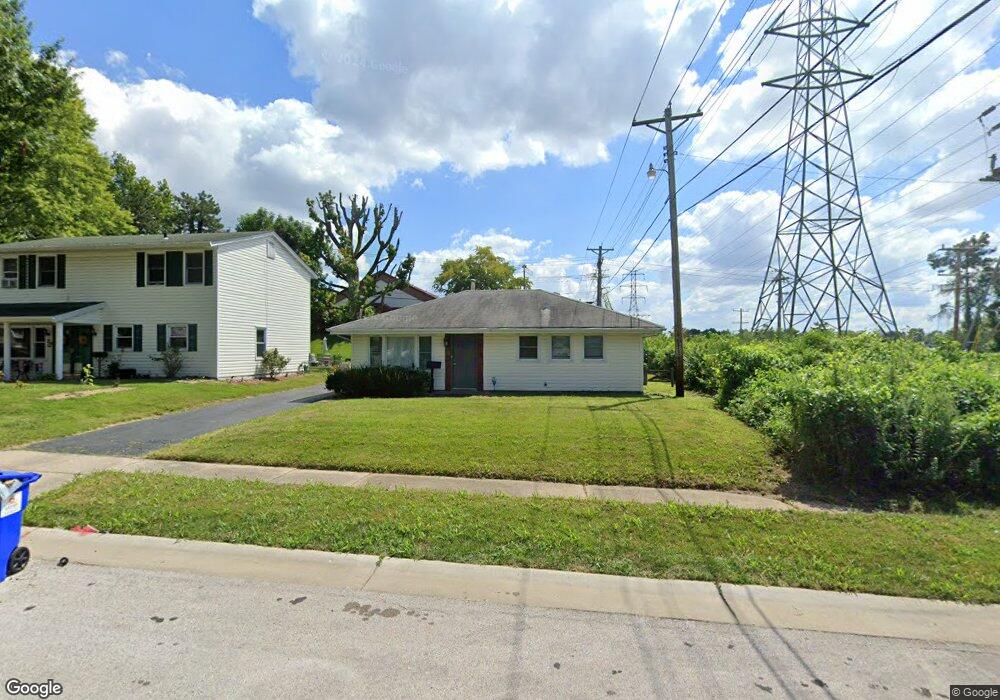
10 Saint Maurice Ln Florissant, MO 63031
Estimated Value: $131,167 - $140,000
2
Beds
1
Bath
864
Sq Ft
$156/Sq Ft
Est. Value
About This Home
This home is located at 10 Saint Maurice Ln, Florissant, MO 63031 and is currently estimated at $134,542, approximately $155 per square foot. 10 Saint Maurice Ln is a home located in St. Louis County with nearby schools including Duchesne Elementary School, Cross Keys Middle School, and McCluer North High School.
Ownership History
Date
Name
Owned For
Owner Type
Purchase Details
Closed on
Feb 28, 2024
Sold by
Claborn Melanie
Bought by
St Louis Solutions Firm Llc
Current Estimated Value
Purchase Details
Closed on
Jan 12, 2024
Sold by
St Louis Solutions Firm Llc
Bought by
Claborn Melanie
Purchase Details
Closed on
Feb 13, 2023
Sold by
Stl Enterprises Llc Nevada Trust
Bought by
St Louis Solutions Firm Llc
Purchase Details
Closed on
Aug 3, 2022
Sold by
St Louis Solutions Firm Llc
Bought by
Stl Enterprises Llc Nevada Trust
Purchase Details
Closed on
Sep 24, 2019
Sold by
Wmac 2013 Llc
Bought by
St Louis Solutions Firm
Home Financials for this Owner
Home Financials are based on the most recent Mortgage that was taken out on this home.
Original Mortgage
$50,000
Interest Rate
3.6%
Mortgage Type
Commercial
Purchase Details
Closed on
Oct 22, 2018
Sold by
Wmac 2014 Llc
Bought by
Wmac 2013 Llc
Purchase Details
Closed on
Aug 29, 2018
Sold by
St Louis County
Bought by
Wmac 2014 Llc
Create a Home Valuation Report for This Property
The Home Valuation Report is an in-depth analysis detailing your home's value as well as a comparison with similar homes in the area
Home Values in the Area
Average Home Value in this Area
Purchase History
| Date | Buyer | Sale Price | Title Company |
|---|---|---|---|
| St Louis Solutions Firm Llc | -- | None Listed On Document | |
| Claborn Melanie | -- | None Listed On Document | |
| St Louis Solutions Firm Llc | -- | -- | |
| Stl Enterprises Llc Nevada Trust | -- | None Listed On Document | |
| St Louis Solutions Firm | $27,000 | Investors Title Co Clayton | |
| Wmac 2013 Llc | -- | None Available | |
| Wmac 2014 Llc | -- | None Available |
Source: Public Records
Mortgage History
| Date | Status | Borrower | Loan Amount |
|---|---|---|---|
| Previous Owner | St Louis Solutions Firm | $50,000 |
Source: Public Records
Tax History Compared to Growth
Tax History
| Year | Tax Paid | Tax Assessment Tax Assessment Total Assessment is a certain percentage of the fair market value that is determined by local assessors to be the total taxable value of land and additions on the property. | Land | Improvement |
|---|---|---|---|---|
| 2025 | $1,596 | $24,130 | $4,030 | $20,100 |
| 2024 | $1,596 | $20,420 | $2,770 | $17,650 |
| 2023 | $1,591 | $20,420 | $2,770 | $17,650 |
| 2022 | $1,578 | $17,820 | $4,030 | $13,790 |
| 2021 | $1,551 | $17,820 | $4,030 | $13,790 |
| 2020 | $1,236 | $13,340 | $3,550 | $9,790 |
| 2019 | $1,212 | $13,340 | $3,550 | $9,790 |
| 2018 | $1,200 | $11,800 | $2,050 | $9,750 |
| 2017 | $1,193 | $11,800 | $2,050 | $9,750 |
| 2016 | $1,322 | $12,770 | $3,950 | $8,820 |
| 2015 | $1,330 | $12,770 | $3,950 | $8,820 |
| 2014 | $1,330 | $13,190 | $3,310 | $9,880 |
Source: Public Records
Map
Nearby Homes
- 7350 N Hanley Rd
- 8435 Bridle Spur Dr
- 215 Maple Dr
- 1110 Saint Bernadette Ln
- 250 Maple Dr
- 7450 Sieloff Dr Unit B
- 7446 Sieloff Dr Unit H
- 7407 Sieloff Dr Unit F
- 15 Henson Ln
- 270 W Saint Anthony Ln
- 7427 Sieloff Dr Unit A
- 7299 N Hanley Rd Unit B
- 7222 Hazelcrest Dr
- 8740 Santa Bella Dr Unit C
- 24 Valley Dr
- 8405 Rena Ct
- 7520 Hazelcrest Dr Unit 227
- 840 Pershall Rd
- 200 Calbreath Ct
- 50 Saint Walter Ln
- 20 Saint Maurice Ln
- 30 Saint Maurice Ln
- 15 Saint Maurice Ln
- 40 Saint Maurice Ln
- 50 Saint Maurice Ln
- 35 Saint Maurice Ln
- 1245 Saint Patrice Ln
- 60 Saint Maurice Ln
- 1260 Saint Patrice Ln
- 55 Saint Maurice Ln
- 1235 Saint Patrice Ln
- 1250 Saint Patrice Ln
- 70 Saint Maurice Ln
- 65 Saint Maurice Ln
- 1225 Saint Patrice Ln
- 1240 Saint Patrice Ln
- 80 Saint Maurice Ln
- 1230 Saint Patrice Ln
- 1215 Saint Patrice Ln
- 1245 S Lafayette St