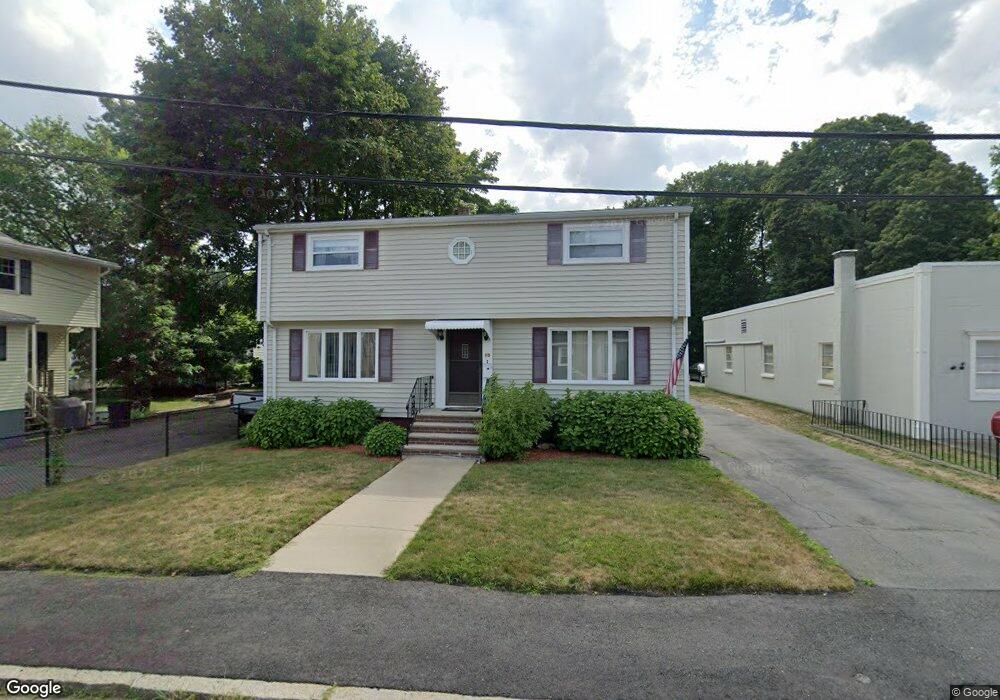
10 Sampo Place Quincy, MA 02169
South Quincy NeighborhoodEstimated Value: $738,693 - $768,000
4
Beds
2
Baths
1,746
Sq Ft
$431/Sq Ft
Est. Value
About This Home
This home is located at 10 Sampo Place, Quincy, MA 02169 and is currently estimated at $751,923, approximately $430 per square foot. 10 Sampo Place is a home located in Norfolk County with nearby schools including South West Middle School, Lincoln-Hancock Community School, and Quincy High School.
Ownership History
Date
Name
Owned For
Owner Type
Purchase Details
Closed on
Feb 3, 2023
Sold by
Josephine Hajjar Irt and Hajjar
Bought by
Gagne Paul F and Gagne Ann M
Current Estimated Value
Home Financials for this Owner
Home Financials are based on the most recent Mortgage that was taken out on this home.
Original Mortgage
$480,000
Outstanding Balance
$463,706
Interest Rate
6.27%
Mortgage Type
Purchase Money Mortgage
Estimated Equity
$288,217
Create a Home Valuation Report for This Property
The Home Valuation Report is an in-depth analysis detailing your home's value as well as a comparison with similar homes in the area
Home Values in the Area
Average Home Value in this Area
Purchase History
| Date | Buyer | Sale Price | Title Company |
|---|---|---|---|
| Gagne Paul F | $600,000 | None Available |
Source: Public Records
Mortgage History
| Date | Status | Borrower | Loan Amount |
|---|---|---|---|
| Open | Gagne Paul F | $480,000 |
Source: Public Records
Tax History Compared to Growth
Tax History
| Year | Tax Paid | Tax Assessment Tax Assessment Total Assessment is a certain percentage of the fair market value that is determined by local assessors to be the total taxable value of land and additions on the property. | Land | Improvement |
|---|---|---|---|---|
| 2025 | $7,718 | $669,400 | $306,900 | $362,500 |
| 2024 | $7,300 | $647,700 | $292,300 | $355,400 |
| 2023 | $6,642 | $596,800 | $265,700 | $331,100 |
| 2022 | $6,383 | $532,800 | $221,400 | $311,400 |
| 2021 | $6,083 | $501,100 | $221,400 | $279,700 |
| 2020 | $5,999 | $482,600 | $221,400 | $261,200 |
| 2019 | $5,749 | $458,100 | $208,900 | $249,200 |
| 2018 | $5,516 | $413,500 | $193,400 | $220,100 |
| 2017 | $5,440 | $383,900 | $184,200 | $199,700 |
| 2016 | $4,979 | $346,700 | $160,200 | $186,500 |
| 2015 | $4,946 | $338,800 | $160,200 | $178,600 |
| 2014 | $4,819 | $324,300 | $160,200 | $164,100 |
Source: Public Records
Map
Nearby Homes
- 21 Totman St Unit 202
- 21 Totman St Unit 309
- 21 Totman St Unit Model-1
- 21 Totman St Unit 209
- 21 Totman St Unit 203
- 21 Totman St Unit 2
- 347 Centre St
- 21 Arthur St
- 118 Brook Rd Unit 2
- 91 Garfield St
- 14 Arthur Ave
- 12 Arthur Ave
- 64 Garfield St Unit B
- 57 Buckley St
- 94 Brook Rd Unit 3
- 46-48 Buckley St
- 56 Penn St Unit 4
- 211 West St Unit 12B
- 51 Brook Rd
- 46 Suomi Rd
- 39 Albertina St
- 45 Albertina St
- 49 Albertina St
- 31 Albertina St
- 31 Albertina St Unit 2
- 15 Sampo Place
- 53 Albertina St
- 46 Albertina St
- 11 Sampo Place
- 27 Albertina St
- 13 Weeden Place
- 17 Weeden Place
- 40 Albertina St
- 57 Albertina St
- 57 Albertina St Unit 3
- 57 Albertina St Unit 2
- 59 Albertina St Unit 59
- 48 Albertina St
- 52 Albertina St
- 52 Albertina St Unit 1/F