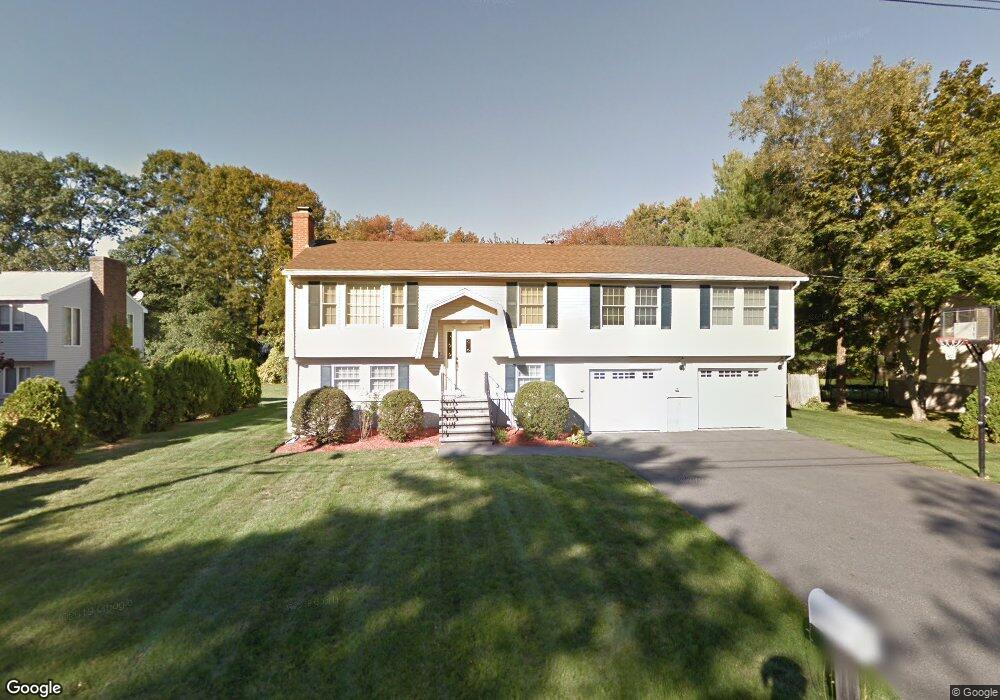
10 Sandra Ave Burlington, MA 01803
North Burlington NeighborhoodEstimated Value: $938,000 - $1,185,000
4
Beds
3
Baths
2,632
Sq Ft
$400/Sq Ft
Est. Value
About This Home
This home is located at 10 Sandra Ave, Burlington, MA 01803 and is currently estimated at $1,052,965, approximately $400 per square foot. 10 Sandra Ave is a home located in Middlesex County with nearby schools including Burlington High School, Fox Hill, and Marshall Simonds Middle School.
Ownership History
Date
Name
Owned For
Owner Type
Purchase Details
Closed on
Mar 3, 2017
Sold by
Almonte Anthony M and Almonte Maria L
Bought by
Almonte Ft
Current Estimated Value
Purchase Details
Closed on
Jul 15, 1994
Sold by
Hospod Thomas and Hospod Barbara
Bought by
Almonte Anthony and Auciello Maria
Home Financials for this Owner
Home Financials are based on the most recent Mortgage that was taken out on this home.
Original Mortgage
$143,000
Interest Rate
8.51%
Mortgage Type
Purchase Money Mortgage
Purchase Details
Closed on
Sep 11, 1987
Sold by
Caceres Nestor
Bought by
Hospod Thomas F
Create a Home Valuation Report for This Property
The Home Valuation Report is an in-depth analysis detailing your home's value as well as a comparison with similar homes in the area
Home Values in the Area
Average Home Value in this Area
Purchase History
| Date | Buyer | Sale Price | Title Company |
|---|---|---|---|
| Almonte Ft | -- | -- | |
| Almonte Ft | -- | -- | |
| Almonte Anthony | $217,000 | -- | |
| Hospod Thomas F | $232,000 | -- |
Source: Public Records
Mortgage History
| Date | Status | Borrower | Loan Amount |
|---|---|---|---|
| Previous Owner | Hospod Thomas F | $134,000 | |
| Previous Owner | Hospod Thomas F | $143,000 | |
| Previous Owner | Hospod Thomas F | $148,600 | |
| Closed | Hospod Thomas F | $0 |
Source: Public Records
Tax History Compared to Growth
Tax History
| Year | Tax Paid | Tax Assessment Tax Assessment Total Assessment is a certain percentage of the fair market value that is determined by local assessors to be the total taxable value of land and additions on the property. | Land | Improvement |
|---|---|---|---|---|
| 2025 | $7,619 | $879,800 | $425,100 | $454,700 |
| 2024 | $7,421 | $830,100 | $403,100 | $427,000 |
| 2023 | $7,212 | $767,200 | $350,100 | $417,100 |
| 2022 | $7,086 | $712,200 | $319,100 | $393,100 |
| 2021 | $6,798 | $683,200 | $290,100 | $393,100 |
| 2020 | $6,586 | $683,200 | $290,100 | $393,100 |
| 2019 | $6,551 | $625,100 | $271,100 | $354,000 |
| 2018 | $6,056 | $570,200 | $258,100 | $312,100 |
| 2017 | $5,940 | $570,200 | $258,100 | $312,100 |
| 2016 | $5,900 | $514,800 | $220,100 | $294,700 |
| 2015 | $5,843 | $514,800 | $220,100 | $294,700 |
| 2014 | $5,672 | $472,700 | $200,100 | $272,600 |
Source: Public Records
Map
Nearby Homes