10 Seaview Rd Ipswich, MA 01938
Estimated Value: $976,878 - $1,289,000
3
Beds
2
Baths
2,756
Sq Ft
$405/Sq Ft
Est. Value
About This Home
This home is located at 10 Seaview Rd, Ipswich, MA 01938 and is currently estimated at $1,116,220, approximately $405 per square foot. 10 Seaview Rd is a home located in Essex County with nearby schools including Ipswich High School.
Ownership History
Date
Name
Owned For
Owner Type
Purchase Details
Closed on
Sep 23, 2016
Sold by
Thomson Sarah W
Bought by
Welch Dale W and Ostberg Kristin W
Current Estimated Value
Purchase Details
Closed on
Dec 15, 1993
Sold by
Gavin John C and Gavin Carol A
Bought by
Thomson Sarah W
Create a Home Valuation Report for This Property
The Home Valuation Report is an in-depth analysis detailing your home's value as well as a comparison with similar homes in the area
Home Values in the Area
Average Home Value in this Area
Purchase History
| Date | Buyer | Sale Price | Title Company |
|---|---|---|---|
| Welch Dale W | $577,500 | -- | |
| Thomson Sarah W | $149,500 | -- | |
| Thomson Sarah W | $149,500 | -- |
Source: Public Records
Mortgage History
| Date | Status | Borrower | Loan Amount |
|---|---|---|---|
| Previous Owner | Thomson Sarah W | $90,000 | |
| Previous Owner | Thomson Sarah W | $30,000 | |
| Previous Owner | Thomson Sarah W | $45,000 |
Source: Public Records
Tax History Compared to Growth
Tax History
| Year | Tax Paid | Tax Assessment Tax Assessment Total Assessment is a certain percentage of the fair market value that is determined by local assessors to be the total taxable value of land and additions on the property. | Land | Improvement |
|---|---|---|---|---|
| 2025 | $9,612 | $862,100 | $328,500 | $533,600 |
| 2024 | $8,713 | $765,600 | $328,400 | $437,200 |
| 2023 | $8,607 | $703,800 | $302,900 | $400,900 |
| 2022 | $7,995 | $621,700 | $277,300 | $344,400 |
| 2021 | $7,710 | $583,200 | $264,600 | $318,600 |
| 2020 | $6,770 | $482,900 | $251,800 | $231,100 |
| 2019 | $6,495 | $461,000 | $239,000 | $222,000 |
| 2018 | $6,229 | $437,400 | $226,300 | $211,100 |
| 2017 | $5,863 | $413,200 | $208,000 | $205,200 |
| 2016 | $5,731 | $385,900 | $208,000 | $177,900 |
| 2015 | $5,115 | $378,600 | $200,700 | $177,900 |
Source: Public Records
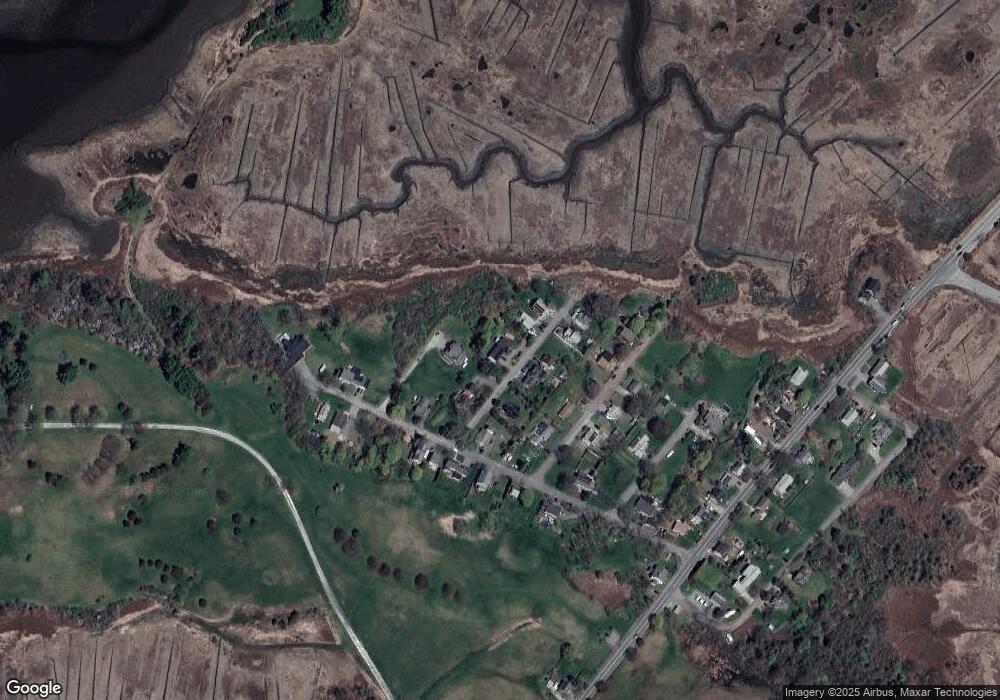
Map
Nearby Homes
- 23 Jeffrey's Neck Rd
- 24 Island Park Rd
- 18 Northridge Rd
- 11 Spillers Ln
- 57 East St
- 63 N Ridge Rd
- 20 Summer St Unit 20
- 0 Lanes End
- 16 Elm St
- 128 High St Unit 4
- 11 Washington St Unit 11
- 11 Washington St
- 11 Washington St Unit 7
- 11 Washington St Unit 5
- 11 Washington St Unit 10
- 11 Washington St Unit 4
- 11 Washington St Unit 12
- 11 Washington St Unit Nine
- 50 Market St Unit 2
- 50-56 Market St