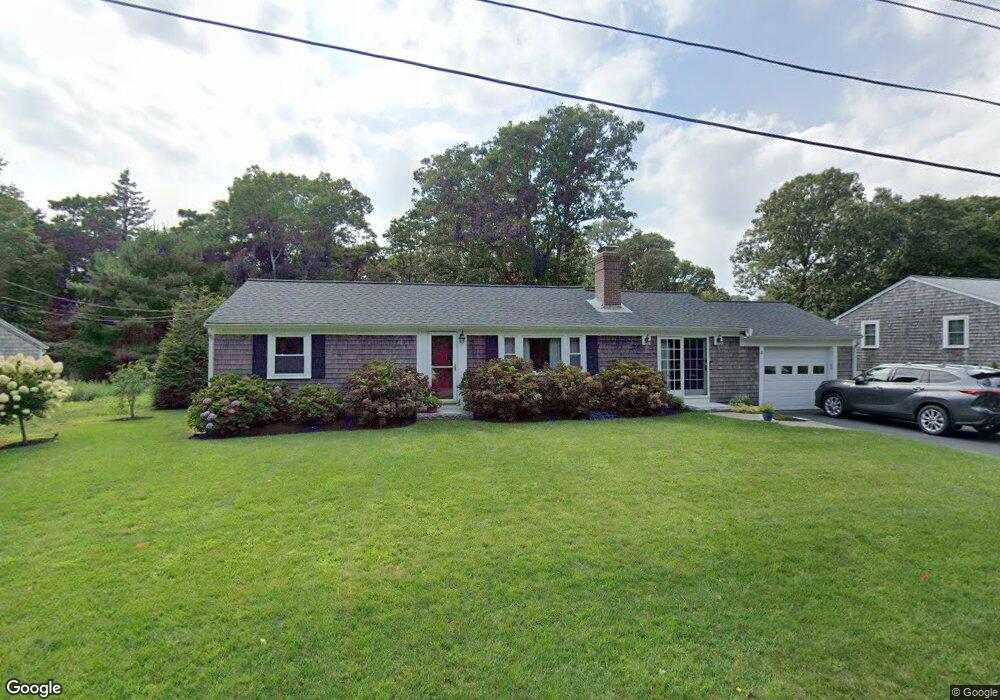
10 Seaward Ln Harwich, MA 02645
Harwich Center NeighborhoodEstimated Value: $617,000 - $774,000
3
Beds
2
Baths
1,001
Sq Ft
$668/Sq Ft
Est. Value
About This Home
This home is located at 10 Seaward Ln, Harwich, MA 02645 and is currently estimated at $668,690, approximately $668 per square foot. 10 Seaward Ln is a home located in Barnstable County with nearby schools including Harwich Elementary School, Chatham Elementary School, and Monomoy Regional Middle School.
Ownership History
Date
Name
Owned For
Owner Type
Purchase Details
Closed on
Oct 3, 1994
Sold by
Fnma
Bought by
Knapp Douglas A and Knapp Martha Gordon
Current Estimated Value
Purchase Details
Closed on
Jul 1, 1994
Sold by
Smith Peter S and Smith Dianne J
Bought by
Federal National Mortgage Association
Purchase Details
Closed on
Nov 2, 1990
Sold by
Wilkinson Robert A
Bought by
Smith Peter S
Create a Home Valuation Report for This Property
The Home Valuation Report is an in-depth analysis detailing your home's value as well as a comparison with similar homes in the area
Home Values in the Area
Average Home Value in this Area
Purchase History
| Date | Buyer | Sale Price | Title Company |
|---|---|---|---|
| Knapp Douglas A | $96,000 | -- | |
| Federal National Mortgage Association | $93,000 | -- | |
| Smith Peter S | $127,500 | -- |
Source: Public Records
Mortgage History
| Date | Status | Borrower | Loan Amount |
|---|---|---|---|
| Open | Smith Peter S | $130,000 | |
| Closed | Smith Peter S | $50,000 | |
| Closed | Smith Peter S | $96,000 |
Source: Public Records
Tax History Compared to Growth
Tax History
| Year | Tax Paid | Tax Assessment Tax Assessment Total Assessment is a certain percentage of the fair market value that is determined by local assessors to be the total taxable value of land and additions on the property. | Land | Improvement |
|---|---|---|---|---|
| 2025 | $3,340 | $565,200 | $203,700 | $361,500 |
| 2024 | $3,146 | $521,700 | $192,100 | $329,600 |
| 2023 | $3,019 | $454,600 | $174,700 | $279,900 |
| 2022 | $2,980 | $367,500 | $151,900 | $215,600 |
| 2021 | $2,797 | $325,200 | $138,100 | $187,100 |
| 2020 | $2,787 | $319,300 | $135,200 | $184,100 |
| 2019 | $2,613 | $301,400 | $129,900 | $171,500 |
| 2018 | $2,634 | $290,600 | $118,100 | $172,500 |
| 2017 | $2,431 | $271,000 | $107,600 | $163,400 |
| 2016 | $2,377 | $262,100 | $107,600 | $154,500 |
| 2015 | $2,293 | $255,600 | $105,500 | $150,100 |
| 2014 | $2,193 | $250,000 | $102,400 | $147,600 |
Source: Public Records
Map
Nearby Homes
- 15 Shannon Rd
- 28 Dale Rd
- 106 Chatham Rd
- 21 Princes St
- 303 Bank St
- 44 Beriah Brooks Rd
- 820 Massachusetts 28
- 53 Freeman St
- 9 Jason Ln
- 116 Parallel St
- 4 Hope Ln
- 11 Windjammer Rd
- 8 Old Wharf Rd
- 27 Quaker Ln
- 957 Orleans Rd
- 42 Marthas Ln
- 15 Pleasant St Unit W24
- 1025 Orleans-Harwich Rd
- 6 Marthas Ln
- 515 Route 28