10 Seth Dr Attleboro, MA 02703
Estimated Value: $644,118 - $796,000
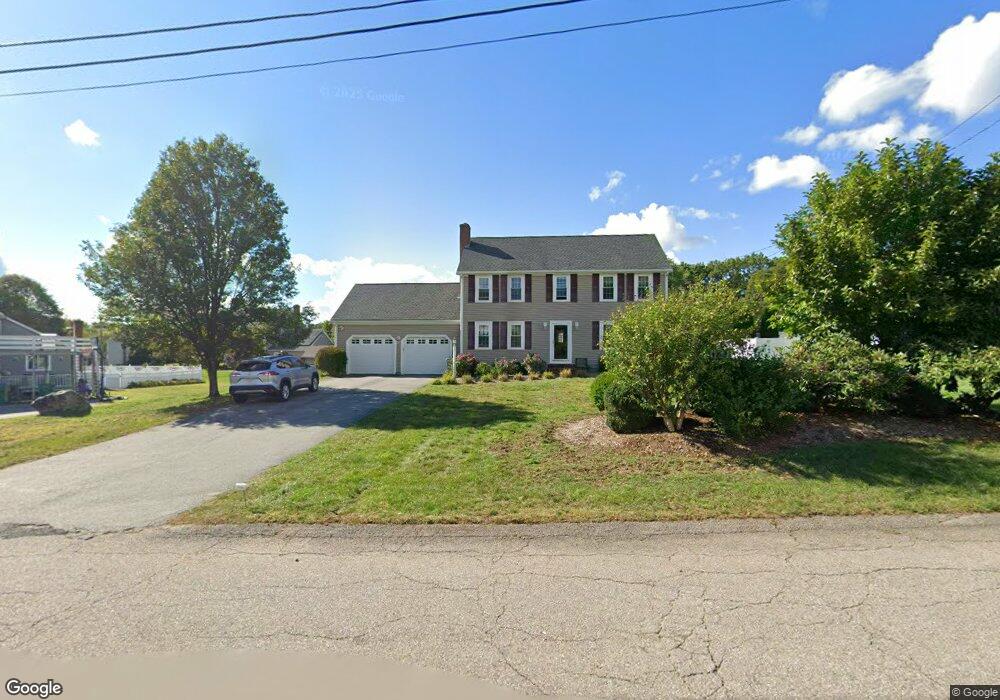
About This Home
This home is located at 10 Seth Dr, Attleboro, MA 02703 and is currently estimated at $718,780, approximately $381 per square foot. 10 Seth Dr is a home located in Bristol County with nearby schools including Hill-Roberts Elementary School, Robert J. Coelho Middle School, and Attleboro High School.
Ownership History
We collect this data history from publicly available records. To have your information removed, we recommend requesting removal directly through your county’s website.
Purchase Details
Home Financials for this Owner
Home Financials are based on the most recent Mortgage that was taken out on this home.Purchase Details
Home Values in the Area
Average Home Value in this Area
Purchase History
We collect this data history from publicly available records. To have your information removed, we recommend requesting removal directly through your county’s website.
| Date | Buyer | Sale Price | Title Company |
|---|---|---|---|
| $168,000 | -- | ||
| $185,000 | -- |
Mortgage History
We collect this data history from publicly available records. To have your information removed, we recommend requesting removal directly through your county’s website.
| Date | Status | Borrower | Loan Amount |
|---|---|---|---|
| Open | $125,000 | ||
| Closed | $150,000 | ||
| Closed | $151,200 |
Tax History
We collect this data history from publicly available records. To have your information removed, we recommend requesting removal directly through your county’s website.
| Year | Tax Paid | Tax Assessment Tax Assessment Total Assessment is a certain percentage of the fair market value that is determined by local assessors to be the total taxable value of land and additions on the property. | Land | Improvement |
|---|---|---|---|---|
| 2025 | $6,685 | $532,700 | $182,400 | $350,300 |
| 2024 | $6,767 | $531,600 | $200,600 | $331,000 |
| 2023 | $6,107 | $446,100 | $175,900 | $270,200 |
| 2022 | $5,696 | $394,200 | $155,500 | $238,700 |
| 2021 | $5,668 | $383,000 | $149,600 | $233,400 |
| 2020 | $5,387 | $370,000 | $142,000 | $228,000 |
| 2019 | $5,242 | $370,200 | $139,300 | $230,900 |
| 2018 | $5,082 | $342,900 | $135,300 | $207,600 |
| 2017 | $5,072 | $348,600 | $140,600 | $208,000 |
| 2016 | $4,904 | $330,900 | $131,400 | $199,500 |
| 2015 | $4,769 | $324,200 | $131,400 | $192,800 |
| 2014 | $4,706 | $316,900 | $126,300 | $190,600 |
Map
- 60 Morse Ave
- 24 Lynn Dr
- 1531 County St
- 276 Newport Ave
- 65 May St
- 759 Newport Ave
- 52 Liberty Dr
- 119 Rene Dr
- 0 Pitas Ave
- 1340 County St
- 15 Campus Rd
- 48 Hudson St
- 35 Buena Vista Dr
- 23 Magnolia St Unit 2
- 49 Brown St
- 44 Tomlinson Rd
- 99 Revere St
- 148 Curtis Ave
- 1346 Newport Ave Unit B22
- 1346 Newport Ave Unit c-11
Ask me questions while you tour the home.