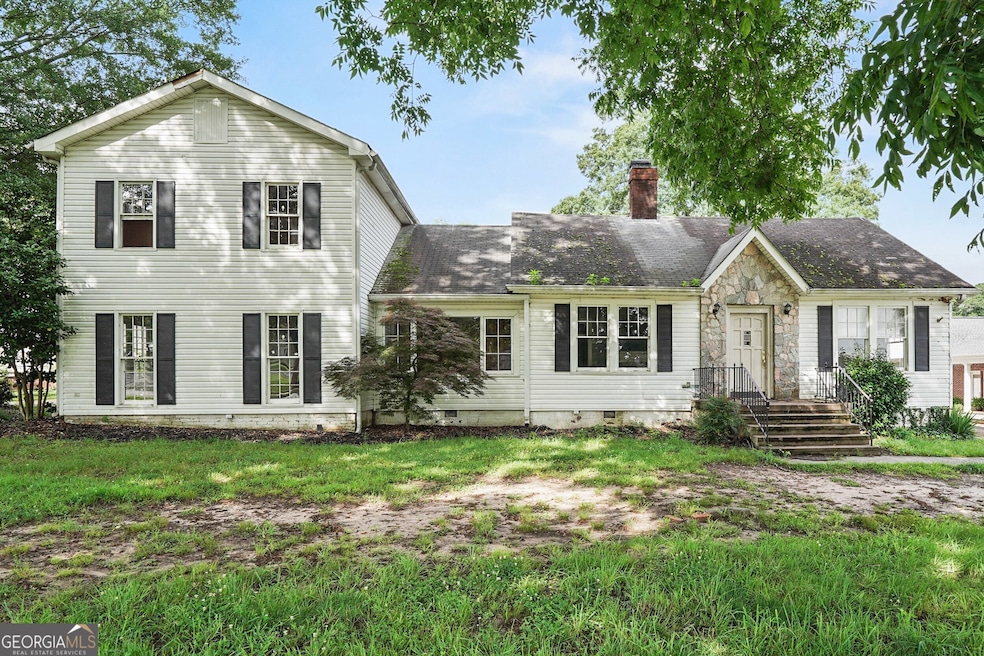
10 Shadburn Ferry Rd Buford, GA 30518
Estimated payment $2,408/month
Highlights
- Seasonal View
- Wood Flooring
- 2 Car Garage
- Buford Elementary School Rated A
- No HOA
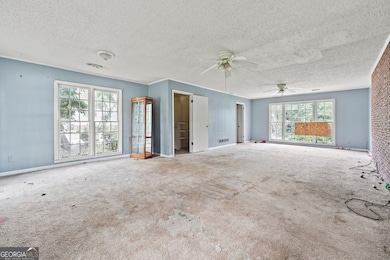
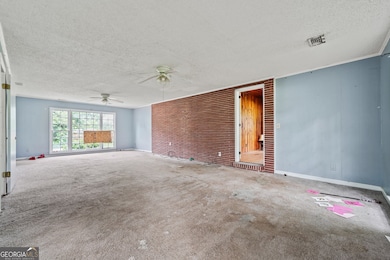
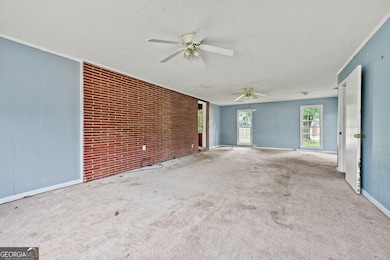
About This Home
Hard to find fixer upper in the City of Buford. Would make a great flip or an amazing home for years to come. Excellent location, great lot, good bones, and lots of hidden opportunities. Home will not last long.
Home Details
Home Type
- Single Family
Est. Annual Taxes
- $2,019
Year Built
- Built in 1940
Home Design
- Slab Foundation
- Vinyl Siding
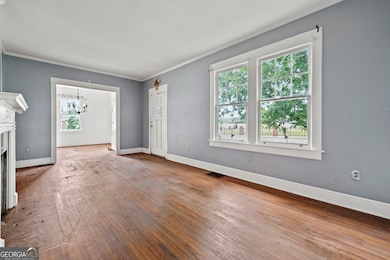
Interior Spaces
- 2,588 Sq Ft Home
- 2-Story Property
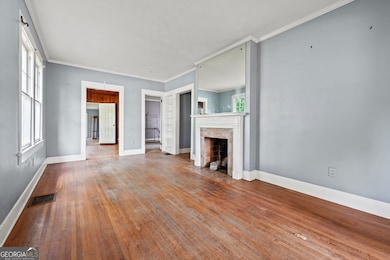
- Fireplace Features Masonry
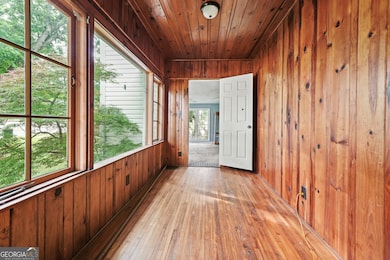
- Wood Flooring
- Seasonal Views
Bedrooms and Bathrooms
Parking
- 2 Car Garage
- Parking Accessed On Kitchen Level
Schools
- Buford Academy Elementary School
- Buford Middle School
- Buford High School
Additional Features
- 0.26 Acre Lot
- No Heating
Community Details
- No Home Owners Association
Listing and Financial Details
- Legal Lot and Block 1 / U
Map
Home Values in the Area
Average Home Value in this Area
Tax History
| Year | Tax Paid | Tax Assessment Tax Assessment Total Assessment is a certain percentage of the fair market value that is determined by local assessors to be the total taxable value of land and additions on the property. | Land | Improvement |
|---|---|---|---|---|
| 2024 | $2,019 | $140,680 | $33,600 | $107,080 |
| 2023 | $2,019 | $110,960 | $26,000 | $84,960 |
| 2022 | $1,592 | $110,960 | $26,000 | $84,960 |
| 2021 | $978 | $68,120 | $16,800 | $51,320 |
| 2020 | $978 | $68,120 | $16,800 | $51,320 |
| 2019 | $883 | $68,120 | $16,800 | $51,320 |
| 2018 | $705 | $53,640 | $5,600 | $48,040 |
| 2016 | $687 | $53,640 | $5,600 | $48,040 |
| 2015 | $712 | $53,640 | $5,600 | $48,040 |
| 2014 | -- | $52,760 | $8,000 | $44,760 |
Property History
| Date | Event | Price | List to Sale | Price per Sq Ft |
|---|---|---|---|---|
| 11/12/2025 11/12/25 | Pending | -- | -- | -- |
| 10/07/2025 10/07/25 | Price Changed | $425,000 | 0.0% | $164 / Sq Ft |
| 10/07/2025 10/07/25 | For Sale | $425,000 | -5.6% | $164 / Sq Ft |
| 08/22/2025 08/22/25 | Pending | -- | -- | -- |
| 08/06/2025 08/06/25 | Price Changed | $450,000 | -9.1% | $174 / Sq Ft |
| 07/02/2025 07/02/25 | For Sale | $495,000 | -- | $191 / Sq Ft |
Purchase History
| Date | Type | Sale Price | Title Company |
|---|---|---|---|
| Warranty Deed | -- | -- | |
| Warranty Deed | $170,000 | -- | |
| Deed | $165,000 | -- | |
| Deed | $154,900 | -- |
Mortgage History
| Date | Status | Loan Amount | Loan Type |
|---|---|---|---|
| Previous Owner | $161,400 | New Conventional | |
| Previous Owner | $129,200 | New Conventional | |
| Previous Owner | $100,000 | New Conventional |
Source: Georgia MLS
MLS Number: 10555893
APN: 7-302-016
Disclaimer: Certain information contained herein is derived from information provided by parties other than Homes.com. All information provided is deemed reliable, but is not guaranteed to be accurate and should be independently verified.
![]() The data relating to real estate for sale on this web site comes in part from the Broker Reciprocity Program of Georgia MLS. Real estate listings held by brokerage firms other than Redfin are marked with the Broker Reciprocity logo and detailed information about them includes the name of the listing brokers. Information deemed reliable but not guaranteed. Copyright 2025 Georgia MLS. All rights reserved.
The data relating to real estate for sale on this web site comes in part from the Broker Reciprocity Program of Georgia MLS. Real estate listings held by brokerage firms other than Redfin are marked with the Broker Reciprocity logo and detailed information about them includes the name of the listing brokers. Information deemed reliable but not guaranteed. Copyright 2025 Georgia MLS. All rights reserved.
- 25 Stonehedge Dr
- 48 Stonehedge Ct
- 157 Shadburn Ferry Rd
- 304 E Jackson St
- 408 Bona Rd
- 550 Gwinnett St
- 4933 Greenard Watson Ln
- 120 Gwinnett St
- 130 Legion Dr
- 1098 Caruso Dr
- 5789 Creek Indian Dr
- 1481 Buice Crest Dr
- 286 Oakland Ave
- 282 Oakland Ave
- 489 Williams St
- 4817 Cooper Farm Dr
- 401 Pirkle Ave
- 480 S Hill St
- 185 Scott St
