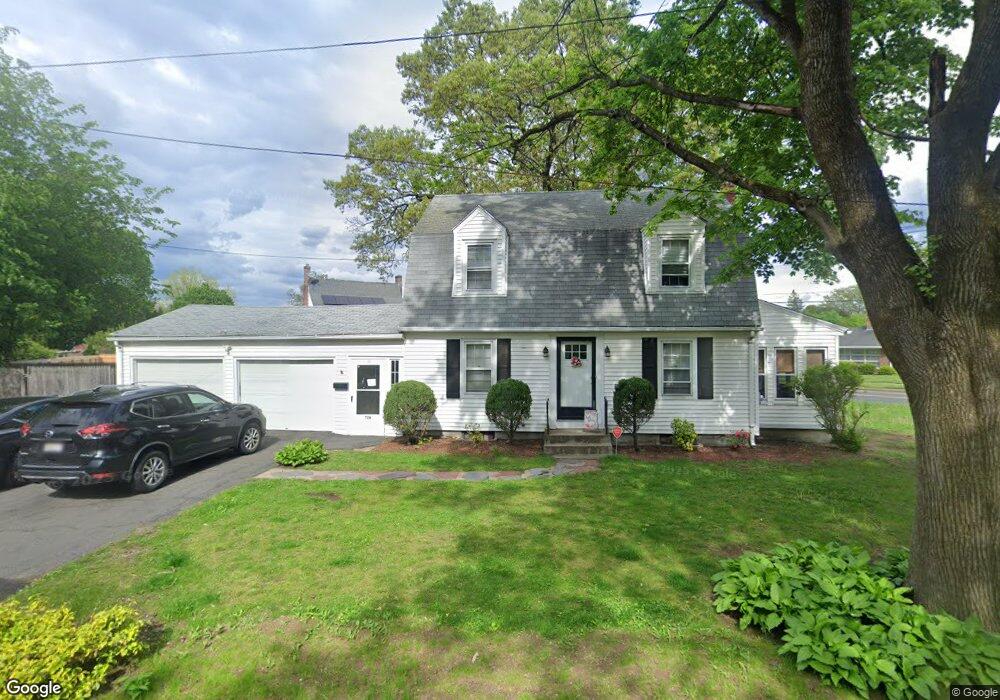
10 Sheridan Ave West Springfield, MA 01089
Estimated Value: $330,009 - $374,000
3
Beds
2
Baths
1,520
Sq Ft
$232/Sq Ft
Est. Value
About This Home
This home is located at 10 Sheridan Ave, West Springfield, MA 01089 and is currently estimated at $352,002, approximately $231 per square foot. 10 Sheridan Ave is a home located in Hampden County with nearby schools including St Thomas The Apostle School.
Ownership History
Date
Name
Owned For
Owner Type
Purchase Details
Closed on
Dec 12, 2019
Sold by
Granger Christopher A and Granger Beverly J
Bought by
Theriaque Lindsay B and Vidanova Jillian M
Current Estimated Value
Create a Home Valuation Report for This Property
The Home Valuation Report is an in-depth analysis detailing your home's value as well as a comparison with similar homes in the area
Home Values in the Area
Average Home Value in this Area
Purchase History
| Date | Buyer | Sale Price | Title Company |
|---|---|---|---|
| Theriaque Lindsay B | -- | None Available |
Source: Public Records
Tax History Compared to Growth
Tax History
| Year | Tax Paid | Tax Assessment Tax Assessment Total Assessment is a certain percentage of the fair market value that is determined by local assessors to be the total taxable value of land and additions on the property. | Land | Improvement |
|---|---|---|---|---|
| 2025 | $4,043 | $271,900 | $107,500 | $164,400 |
| 2024 | $3,840 | $259,300 | $107,500 | $151,800 |
| 2023 | $3,697 | $237,900 | $107,500 | $130,400 |
| 2022 | $3,358 | $213,100 | $96,500 | $116,600 |
| 2021 | $3,243 | $191,900 | $88,000 | $103,900 |
| 2020 | $3,113 | $183,200 | $88,000 | $95,200 |
| 2019 | $3,107 | $183,200 | $88,000 | $95,200 |
| 2018 | $3,124 | $183,200 | $88,000 | $95,200 |
| 2017 | $3,124 | $183,200 | $88,000 | $95,200 |
| 2016 | $3,087 | $181,700 | $84,600 | $97,100 |
| 2015 | $3,028 | $178,200 | $82,900 | $95,300 |
| 2014 | $758 | $184,000 | $82,900 | $101,100 |
Source: Public Records
Map
Nearby Homes