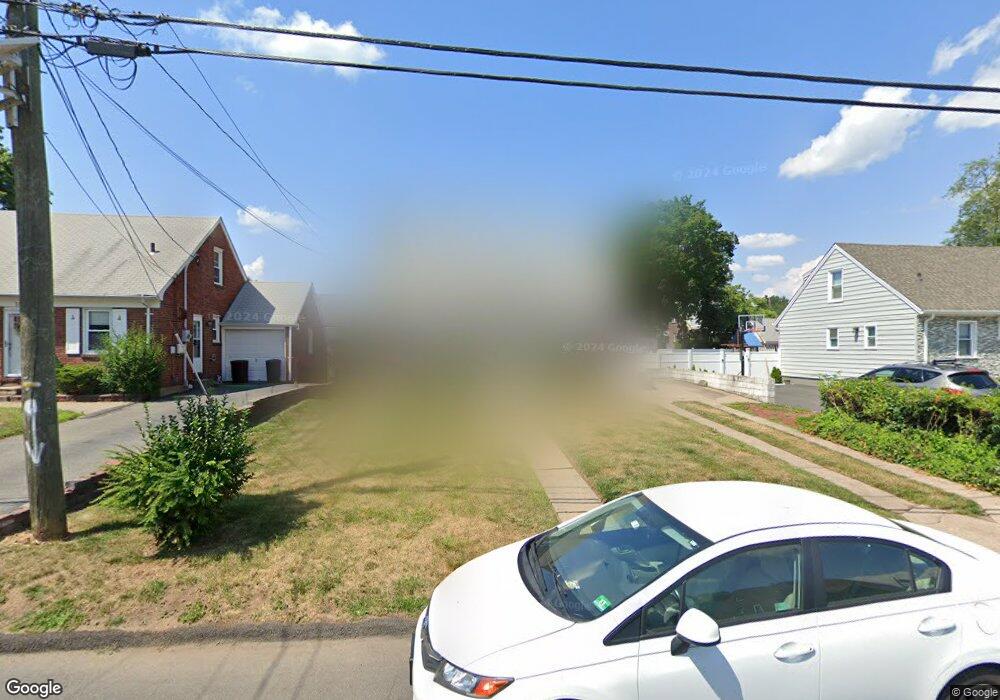
10 Sherwood Rd Dumont, NJ 07628
Estimated Value: $623,000 - $666,000
4
Beds
2
Baths
1,209
Sq Ft
$531/Sq Ft
Est. Value
About This Home
This home is located at 10 Sherwood Rd, Dumont, NJ 07628 and is currently estimated at $642,296, approximately $531 per square foot. 10 Sherwood Rd is a home located in Bergen County with nearby schools including Dumont High School and Institute For Educational Achievement.
Ownership History
Date
Name
Owned For
Owner Type
Purchase Details
Closed on
Jan 13, 2021
Sold by
Ness Properties Llc
Bought by
Levy Griffin and Wilson Jessica
Current Estimated Value
Home Financials for this Owner
Home Financials are based on the most recent Mortgage that was taken out on this home.
Original Mortgage
$413,250
Interest Rate
2.73%
Mortgage Type
New Conventional
Purchase Details
Closed on
Jul 9, 2020
Sold by
Mortgage Equity Conversion Asset Trust
Bought by
Ness Properties Llc
Purchase Details
Closed on
Jun 25, 2019
Sold by
Doll Doris H
Bought by
Us Bank Na
Create a Home Valuation Report for This Property
The Home Valuation Report is an in-depth analysis detailing your home's value as well as a comparison with similar homes in the area
Home Values in the Area
Average Home Value in this Area
Purchase History
| Date | Buyer | Sale Price | Title Company |
|---|---|---|---|
| Levy Griffin | $440,000 | Sunnyside Title Agency Llc | |
| Ness Properties Llc | $295,000 | Fortune Title Agency Inc | |
| Us Bank Na | $540,000 | None Available |
Source: Public Records
Mortgage History
| Date | Status | Borrower | Loan Amount |
|---|---|---|---|
| Previous Owner | Levy Griffin | $413,250 |
Source: Public Records
Tax History Compared to Growth
Tax History
| Year | Tax Paid | Tax Assessment Tax Assessment Total Assessment is a certain percentage of the fair market value that is determined by local assessors to be the total taxable value of land and additions on the property. | Land | Improvement |
|---|---|---|---|---|
| 2025 | $12,386 | $482,800 | $285,000 | $197,800 |
| 2024 | $12,081 | $304,700 | $160,000 | $144,700 |
| 2023 | $11,832 | $304,700 | $160,000 | $144,700 |
| 2022 | $11,832 | $304,700 | $160,000 | $144,700 |
| 2021 | $11,774 | $254,400 | $160,000 | $94,400 |
| 2020 | $9,563 | $254,400 | $160,000 | $94,400 |
| 2019 | $9,334 | $254,400 | $160,000 | $94,400 |
| 2018 | $9,143 | $254,400 | $160,000 | $94,400 |
| 2017 | $8,968 | $254,400 | $160,000 | $94,400 |
| 2016 | $8,759 | $254,400 | $160,000 | $94,400 |
| 2015 | $8,308 | $254,400 | $160,000 | $94,400 |
| 2014 | $8,140 | $254,400 | $160,000 | $94,400 |
Source: Public Records
Map
Nearby Homes