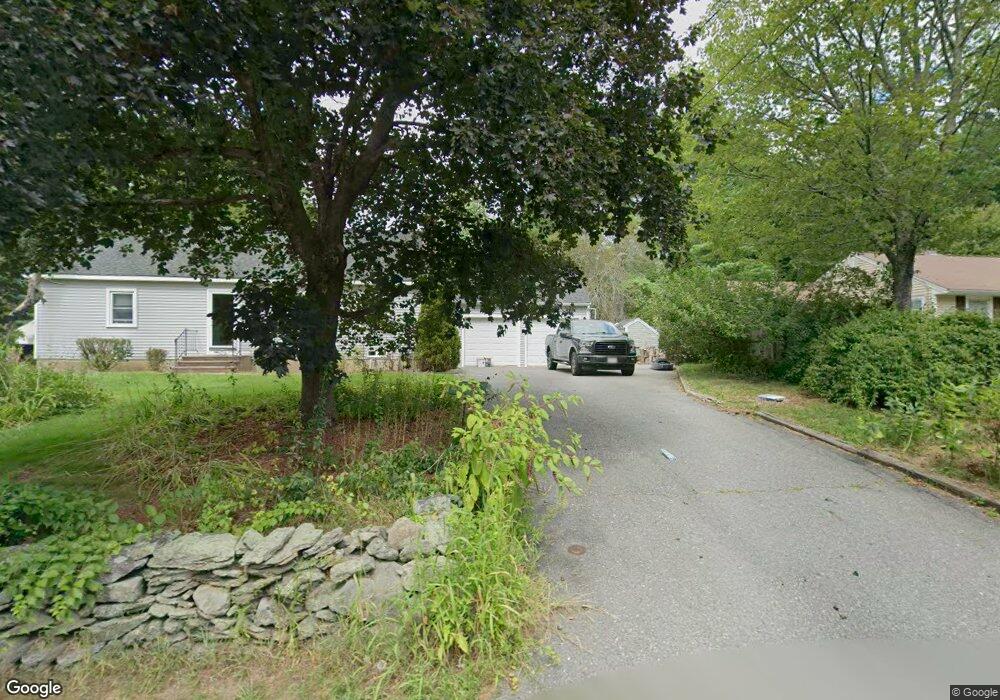
10 Smith St Townsend, MA 01469
Estimated Value: $474,000 - $609,000
4
Beds
2
Baths
2,117
Sq Ft
$257/Sq Ft
Est. Value
About This Home
This home is located at 10 Smith St, Townsend, MA 01469 and is currently estimated at $544,222, approximately $257 per square foot. 10 Smith St is a home located in Middlesex County with nearby schools including North Middlesex Regional High School.
Ownership History
Date
Name
Owned For
Owner Type
Purchase Details
Closed on
Aug 12, 2009
Sold by
Perry James M and Perry Colleen A
Bought by
Derosa Amy M and Derosa Adam J
Current Estimated Value
Home Financials for this Owner
Home Financials are based on the most recent Mortgage that was taken out on this home.
Original Mortgage
$260,200
Outstanding Balance
$170,945
Interest Rate
5.36%
Mortgage Type
Purchase Money Mortgage
Estimated Equity
$373,277
Purchase Details
Closed on
Apr 10, 2007
Sold by
Watson Robert A and Watson Anne
Bought by
Perry Colleen A and Perry James M
Home Financials for this Owner
Home Financials are based on the most recent Mortgage that was taken out on this home.
Original Mortgage
$211,750
Interest Rate
6.25%
Mortgage Type
Purchase Money Mortgage
Purchase Details
Closed on
Jul 19, 2002
Sold by
Gargan Kenneth R
Bought by
Watson Robert A and Watson Anne
Home Financials for this Owner
Home Financials are based on the most recent Mortgage that was taken out on this home.
Original Mortgage
$252,605
Interest Rate
6.73%
Mortgage Type
Purchase Money Mortgage
Purchase Details
Closed on
Apr 29, 1994
Sold by
Blood Robert E and Blood Jo A
Bought by
Gragan Kenneth R
Home Financials for this Owner
Home Financials are based on the most recent Mortgage that was taken out on this home.
Original Mortgage
$55,000
Interest Rate
7.7%
Mortgage Type
Purchase Money Mortgage
Create a Home Valuation Report for This Property
The Home Valuation Report is an in-depth analysis detailing your home's value as well as a comparison with similar homes in the area
Home Values in the Area
Average Home Value in this Area
Purchase History
| Date | Buyer | Sale Price | Title Company |
|---|---|---|---|
| Derosa Amy M | $265,000 | -- | |
| Perry Colleen A | $302,500 | -- | |
| Watson Robert A | $274,900 | -- | |
| Gragan Kenneth R | $144,500 | -- |
Source: Public Records
Mortgage History
| Date | Status | Borrower | Loan Amount |
|---|---|---|---|
| Open | Derosa Amy M | $260,200 | |
| Previous Owner | Perry Colleen A | $211,750 | |
| Previous Owner | Watson Robert A | $252,605 | |
| Previous Owner | Gragan Kenneth R | $20,000 | |
| Previous Owner | Gragan Kenneth R | $55,000 |
Source: Public Records
Tax History
| Year | Tax Paid | Tax Assessment Tax Assessment Total Assessment is a certain percentage of the fair market value that is determined by local assessors to be the total taxable value of land and additions on the property. | Land | Improvement |
|---|---|---|---|---|
| 2025 | $6,782 | $467,100 | $90,600 | $376,500 |
| 2024 | $6,597 | $457,800 | $90,600 | $367,200 |
| 2023 | $6,638 | $435,000 | $82,400 | $352,600 |
| 2022 | $6,519 | $370,200 | $71,700 | $298,500 |
| 2021 | $5,966 | $340,100 | $70,900 | $269,200 |
| 2020 | $6,036 | $309,200 | $63,000 | $246,200 |
| 2019 | $19,756 | $298,000 | $63,000 | $235,000 |
| 2018 | $5,535 | $273,200 | $63,000 | $210,200 |
| 2017 | $5,218 | $265,300 | $67,200 | $198,100 |
| 2016 | $4,994 | $252,200 | $67,200 | $185,000 |
| 2015 | $4,749 | $248,500 | $70,000 | $178,500 |
| 2014 | $4,458 | $227,800 | $63,000 | $164,800 |
Source: Public Records
Map
Nearby Homes
- 5 Turnpike Rd Unit 213 TWO
- 1 Depot Street Extension Unit 5
- 1 Depot Street Extension Unit 2
- 1 Depot Street Extension Unit 4
- 16 Worcester Rd
- 0 Brookline St
- 9 Kaneohe Ct
- 364 Townsend Hill Rd
- 18 Beech St
- 7 Balsam Dr
- 86 W Elm Lunenburg Rd Blood Rd
- 198 N End Rd
- 0 Tyler Rd Unit 72560808
- 00 Tyler Rd
- 1235 Townsend Rd
- 1 W Meadow Rd
- 2 Blueberry Hill Rd
- 143 Heald St
- 2 W Meadow Rd
- 43 Shattuck St
Your Personal Tour Guide
Ask me questions while you tour the home.