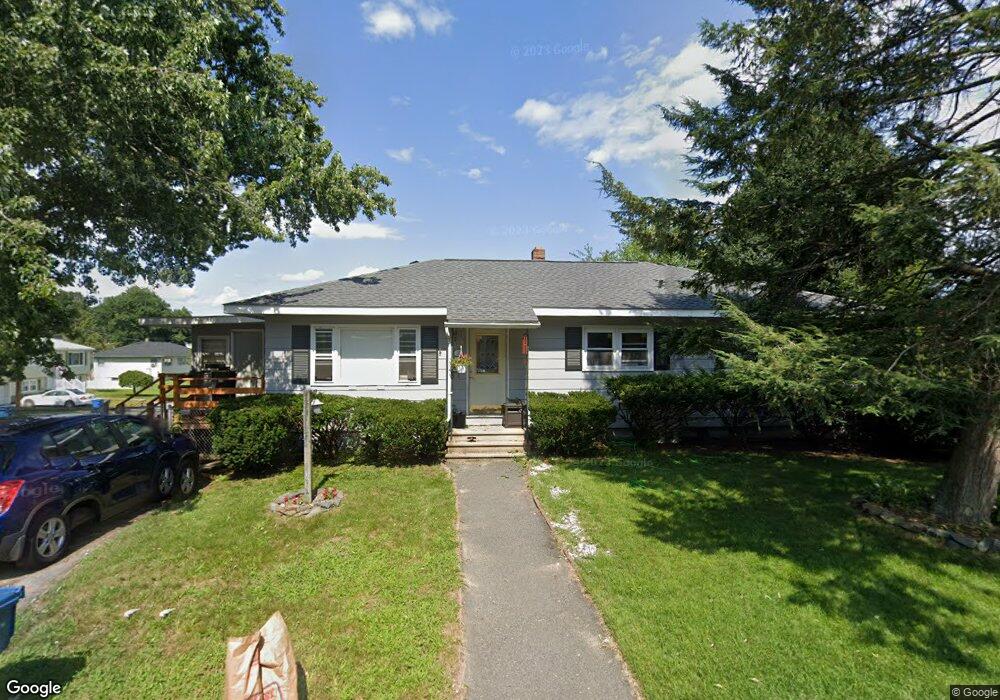
10 Sparkle Dr Lawrence, MA 01843
Mount Vernon NeighborhoodEstimated Value: $506,550 - $575,000
2
Beds
1
Bath
1,244
Sq Ft
$435/Sq Ft
Est. Value
About This Home
This home is located at 10 Sparkle Dr, Lawrence, MA 01843 and is currently estimated at $541,638, approximately $435 per square foot. 10 Sparkle Dr is a home located in Essex County with nearby schools including John Breen School, School For Exceptional Studies, and Robert Frost Middle School.
Ownership History
Date
Name
Owned For
Owner Type
Purchase Details
Closed on
Nov 17, 2009
Sold by
Gaeta Jeanette L and Gaeta Jamie
Bought by
Gaeta Jeanette L
Current Estimated Value
Purchase Details
Closed on
Nov 1, 2004
Sold by
Gaeta Jeanette L and Michaud Jeanette L
Bought by
Gaeta Jamie and Gaeta Jeanette L
Home Financials for this Owner
Home Financials are based on the most recent Mortgage that was taken out on this home.
Original Mortgage
$168,000
Interest Rate
5.74%
Purchase Details
Closed on
Oct 17, 1995
Sold by
Fhlmc
Bought by
Michaud Roger P
Home Financials for this Owner
Home Financials are based on the most recent Mortgage that was taken out on this home.
Original Mortgage
$86,350
Interest Rate
7.71%
Mortgage Type
Purchase Money Mortgage
Purchase Details
Closed on
Dec 21, 1987
Sold by
Boucher Ex J D Rich
Bought by
Gauthier Vicky
Home Financials for this Owner
Home Financials are based on the most recent Mortgage that was taken out on this home.
Original Mortgage
$124,400
Interest Rate
10.78%
Mortgage Type
Purchase Money Mortgage
Create a Home Valuation Report for This Property
The Home Valuation Report is an in-depth analysis detailing your home's value as well as a comparison with similar homes in the area
Home Values in the Area
Average Home Value in this Area
Purchase History
| Date | Buyer | Sale Price | Title Company |
|---|---|---|---|
| Gaeta Jeanette L | -- | -- | |
| Gaeta Jamie | -- | -- | |
| Michaud Roger P | $88,000 | -- | |
| Gauthier Vicky | $131,000 | -- |
Source: Public Records
Mortgage History
| Date | Status | Borrower | Loan Amount |
|---|---|---|---|
| Previous Owner | Gaeta Jamie | $168,000 | |
| Previous Owner | Gauthier Vicky | $86,350 | |
| Previous Owner | Gauthier Vicky | $124,400 |
Source: Public Records
Tax History
| Year | Tax Paid | Tax Assessment Tax Assessment Total Assessment is a certain percentage of the fair market value that is determined by local assessors to be the total taxable value of land and additions on the property. | Land | Improvement |
|---|---|---|---|---|
| 2025 | $3,666 | $416,600 | $160,900 | $255,700 |
| 2024 | $3,600 | $389,200 | $135,800 | $253,400 |
| 2023 | $3,740 | $368,100 | $135,800 | $232,300 |
| 2022 | $3,514 | $307,200 | $123,700 | $183,500 |
| 2021 | $3,307 | $269,500 | $121,100 | $148,400 |
| 2020 | $3,242 | $260,800 | $112,400 | $148,400 |
| 2019 | $3,153 | $230,500 | $99,000 | $131,500 |
| 2018 | $2,881 | $201,200 | $94,000 | $107,200 |
| 2017 | $2,870 | $187,100 | $89,900 | $97,200 |
| 2016 | $2,753 | $177,500 | $77,400 | $100,100 |
| 2015 | $2,684 | $177,500 | $77,400 | $100,100 |
Source: Public Records
Map
Nearby Homes
- 5 Crestwood Cir
- 29 Westchester Dr
- 0
- 9 Oakland Rd
- 58 Chandler Rd
- 35 Adams St
- 2 Boardwalk Dr
- 4 Weeping Willow Dr
- 5 Weeping Willow Dr
- 2 Weeping Willow Dr
- 21 Clubview Dr Unit 21
- 25 Clubview Dr Unit 25
- 12 Robert Dr Unit 12
- 20 Robert Dr Unit 20
- 37 Tewksbury St Unit 39
- 543 Andover St Unit 6
- 11 W Hawley St
- 10 Dartmouth Rd
- 750 Brookside Dr Unit G
- 102 Weare St
- 22 Glenwood Dr
- 14 Sparkle Dr
- 5 Pembroke Dr
- 5 Sparkle Dr
- 9 Sparkle Dr
- 9 Pembroke Dr
- 18 Sparkle Dr
- 25 Glenwood Dr
- 15 Sparkle Dr
- 18 Glenwood Dr
- 368 Mount Vernon St
- 6 Pembroke Dr
- 420 Mount Vernon St
- 21 Glenwood Dr
- 13 Pembroke Dr
- 366 Mount Vernon St
- 22 Sparkle Dr
- 19 Sparkle Dr
- 19B Sparkle Dr
- 10 Pembroke Dr
Your Personal Tour Guide
Ask me questions while you tour the home.