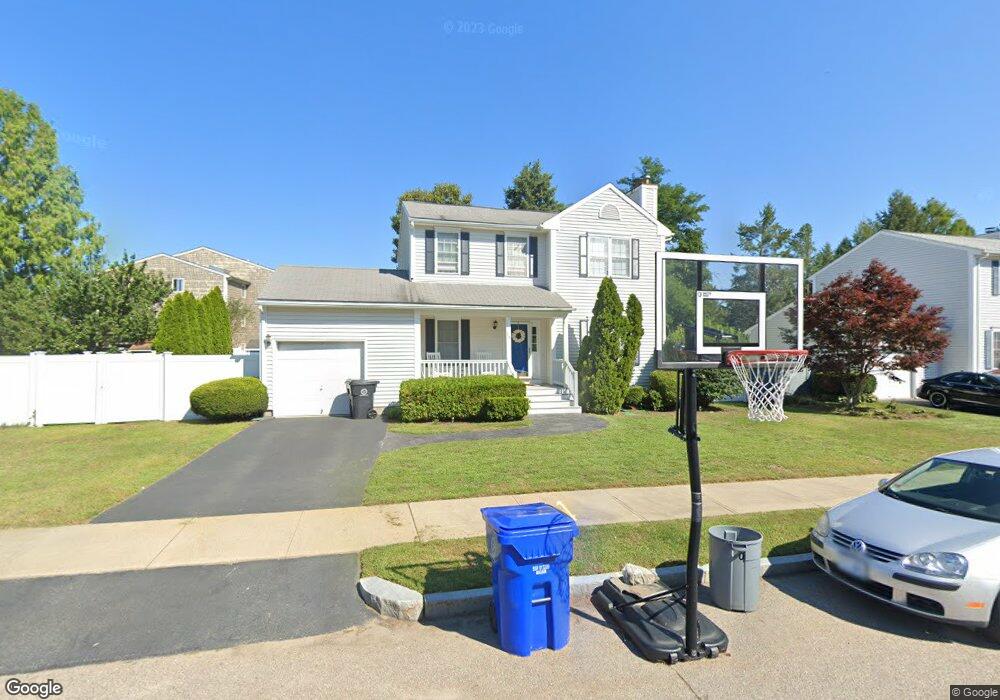
10 Spinnaker Dr Riverside, RI 02915
Riverside NeighborhoodEstimated Value: $533,992 - $636,000
3
Beds
2
Baths
1,440
Sq Ft
$406/Sq Ft
Est. Value
About This Home
This home is located at 10 Spinnaker Dr, Riverside, RI 02915 and is currently estimated at $583,998, approximately $405 per square foot. 10 Spinnaker Dr is a home located in Providence County with nearby schools including East Providence High School, St Luke Elementary School, and St Mary Academy-Bay View.
Ownership History
Date
Name
Owned For
Owner Type
Purchase Details
Closed on
Mar 14, 2013
Sold by
Aruajo Luis and Araujo Josephine
Bought by
Araujo Josephine
Current Estimated Value
Purchase Details
Closed on
Mar 16, 2000
Sold by
Jgp Builders Inc
Bought by
Araujo Luis and Araujo Josephine
Create a Home Valuation Report for This Property
The Home Valuation Report is an in-depth analysis detailing your home's value as well as a comparison with similar homes in the area
Home Values in the Area
Average Home Value in this Area
Purchase History
| Date | Buyer | Sale Price | Title Company |
|---|---|---|---|
| Araujo Josephine | -- | -- | |
| Araujo Luis | $178,000 | -- | |
| Araujo Josephine | -- | -- | |
| Araujo Luis | $178,000 | -- |
Source: Public Records
Mortgage History
| Date | Status | Borrower | Loan Amount |
|---|---|---|---|
| Previous Owner | Araujo Luis | $97,000 | |
| Previous Owner | Araujo Luis | $200,000 | |
| Previous Owner | Araujo Luis | $178,050 |
Source: Public Records
Tax History
| Year | Tax Paid | Tax Assessment Tax Assessment Total Assessment is a certain percentage of the fair market value that is determined by local assessors to be the total taxable value of land and additions on the property. | Land | Improvement |
|---|---|---|---|---|
| 2025 | $6,376 | $487,800 | $150,300 | $337,500 |
| 2024 | $5,996 | $391,100 | $125,300 | $265,800 |
| 2023 | $5,773 | $391,100 | $125,300 | $265,800 |
| 2022 | $6,656 | $304,500 | $98,600 | $205,900 |
| 2021 | $6,547 | $304,500 | $91,400 | $213,100 |
| 2020 | $6,270 | $304,500 | $91,400 | $213,100 |
| 2019 | $6,096 | $304,500 | $91,400 | $213,100 |
| 2018 | $6,372 | $278,500 | $101,100 | $177,400 |
| 2017 | $6,230 | $278,500 | $101,100 | $177,400 |
| 2016 | $6,199 | $278,500 | $101,100 | $177,400 |
| 2015 | $6,357 | $277,000 | $78,200 | $198,800 |
| 2014 | $6,357 | $277,000 | $78,200 | $198,800 |
Source: Public Records
Map
Nearby Homes
Your Personal Tour Guide
Ask me questions while you tour the home.