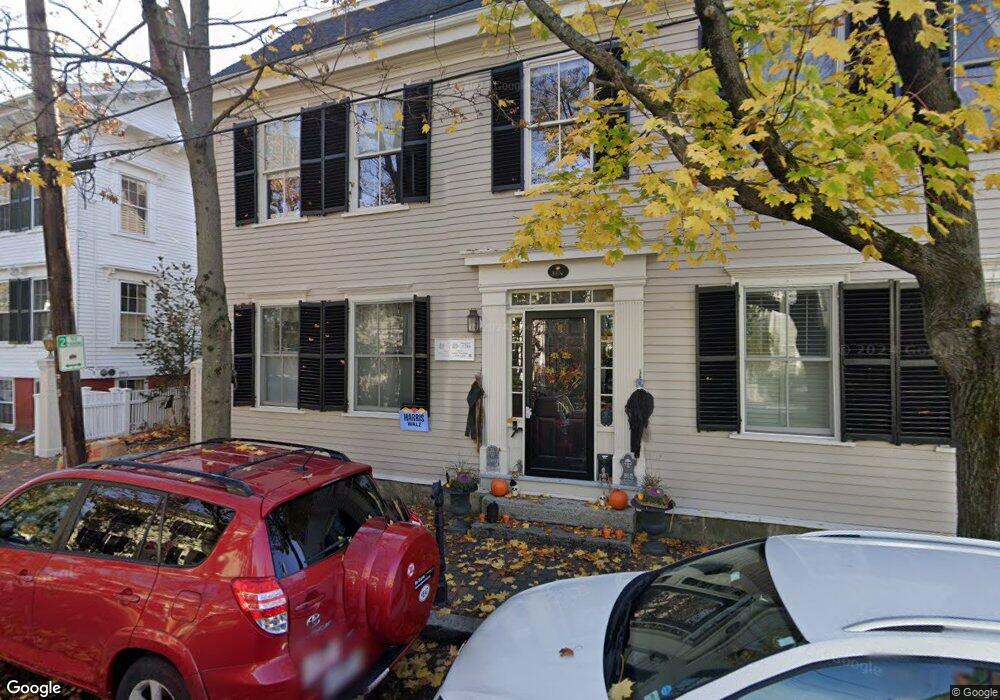
10 Spring St Newburyport, MA 01950
Estimated Value: $1,493,000 - $1,596,000
3
Beds
3
Baths
2,600
Sq Ft
$594/Sq Ft
Est. Value
About This Home
This home is located at 10 Spring St, Newburyport, MA 01950 and is currently estimated at $1,543,343, approximately $593 per square foot. 10 Spring St is a home located in Essex County with nearby schools including Francis T. Bresnahan Elementary School, Edward G. Molin Elementary School, and Rupert A. Nock Middle School.
Ownership History
Date
Name
Owned For
Owner Type
Purchase Details
Closed on
Dec 6, 2023
Sold by
Astrid Lorentzson Ret and Lorentzson
Bought by
10 Spring Street Rt and Santos
Current Estimated Value
Purchase Details
Closed on
Jul 15, 2015
Sold by
Lorentzson Astrid and Santos Jack J
Bought by
Astrid Lorentzson Ret and Lorentzson
Purchase Details
Closed on
Nov 30, 2000
Sold by
Myhre Rebecca T and Myhre James E
Bought by
Seekell Janet L and Kaniwec George
Purchase Details
Closed on
Jul 31, 1995
Sold by
Werner George A and Werner Nancy
Bought by
Myhre Rebecca T and Myhre James
Create a Home Valuation Report for This Property
The Home Valuation Report is an in-depth analysis detailing your home's value as well as a comparison with similar homes in the area
Home Values in the Area
Average Home Value in this Area
Purchase History
| Date | Buyer | Sale Price | Title Company |
|---|---|---|---|
| 10 Spring Street Rt | -- | None Available | |
| Astrid Lorentzson Ret | -- | -- | |
| Seekell Janet L | $475,000 | -- | |
| Myhre Rebecca T | $285,000 | -- |
Source: Public Records
Mortgage History
| Date | Status | Borrower | Loan Amount |
|---|---|---|---|
| Previous Owner | Myhre Rebecca T | $200,000 |
Source: Public Records
Tax History Compared to Growth
Tax History
| Year | Tax Paid | Tax Assessment Tax Assessment Total Assessment is a certain percentage of the fair market value that is determined by local assessors to be the total taxable value of land and additions on the property. | Land | Improvement |
|---|---|---|---|---|
| 2025 | $12,153 | $1,268,600 | $386,300 | $882,300 |
| 2024 | $11,679 | $1,171,400 | $351,200 | $820,200 |
| 2023 | $11,203 | $1,043,100 | $305,400 | $737,700 |
| 2022 | $10,321 | $859,400 | $254,500 | $604,900 |
| 2021 | $9,879 | $781,600 | $231,300 | $550,300 |
| 2020 | $9,418 | $733,500 | $231,300 | $502,200 |
| 2019 | $9,594 | $733,500 | $231,300 | $502,200 |
| 2018 | $9,181 | $692,400 | $220,300 | $472,100 |
| 2017 | $8,968 | $666,800 | $209,800 | $457,000 |
| 2016 | $8,977 | $670,400 | $191,100 | $479,300 |
| 2015 | $8,943 | $670,400 | $191,100 | $479,300 |
Source: Public Records
Map
Nearby Homes
- 42 Federal St Unit B
- 11 Charter St
- 58 Lime St Unit 5
- 10 10th St
- 57 Lime St Unit 1
- 105 State St Unit 301
- 105 State St Unit 101
- 105 State St Unit 201
- 30-32 Water St Unit 4
- 95 High St Unit 4
- 95 High St Unit 1
- 166 Water St Unit B
- 164 Water St Unit A
- 2 Court St Unit 4
- 58 Merrimac St Unit 2-5
- 1 Hill St
- 1 Hill St Unit 1
- 17 Madison St
- 41 Washington St Unit B
- 126 Merrimac St Unit 47
- 10 Spring St
- 12 Spring St
- 8 Spring St
- 8 Spring St Unit 8
- 6 Spring St
- 16 Spring St
- 16 Spring St Unit 2
- 16 Spring St Unit 1
- 7 Orange St
- 5 Orange St
- 7 Spring St
- 7 Spring St Unit 7
- 7 Spring St Unit 1
- 4 Spring St
- 18 Spring St
- 18 Spring St
- 9 Orange St Unit 3
- 9 Orange St Unit 2
- 9 Orange St
- 3 Orange St Unit 5