Estimated Value: $101,615 - $182,000
--
Bed
--
Bath
630
Sq Ft
$227/Sq Ft
Est. Value
About This Home
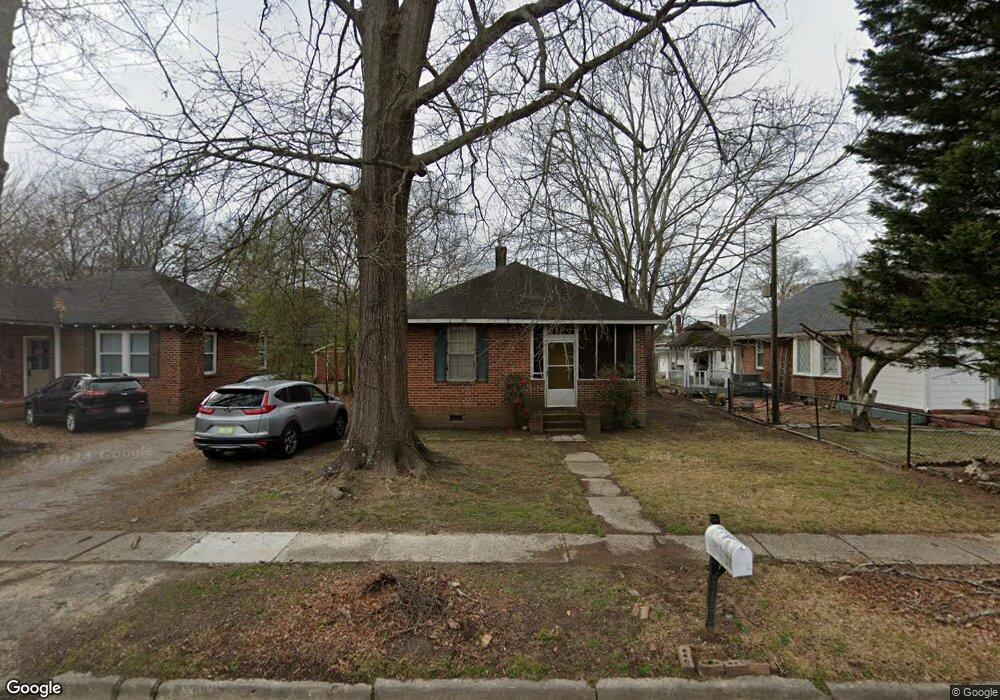
This home is located at 10 Spruce St NE, Rome, GA 30161 and is currently estimated at $143,154, approximately $227 per square foot. 10 Spruce St NE is a home located in Floyd County with nearby schools including Model Middle School, Model High School, and Unity Christian School.
Ownership History
Date
Name
Owned For
Owner Type
Purchase Details
Closed on
Apr 1, 2002
Sold by
Jones Craig A
Bought by
Morris Mark and Joan Morris
Current Estimated Value
Purchase Details
Closed on
Nov 4, 1996
Sold by
Hubbard Garland W & Villa S Hubbard
Bought by
Jones Craig A
Purchase Details
Closed on
Aug 16, 1996
Sold by
Orr Robert L and Orr Linda K
Bought by
Hubbard Garland W & Villa S Hubbard
Purchase Details
Closed on
Jul 26, 1996
Sold by
Orr Robert L
Bought by
Orr Robert L and Orr Linda K
Purchase Details
Closed on
May 25, 1993
Sold by
Orr Robert L and Orr Blanche T
Bought by
Orr Robert L
Purchase Details
Closed on
Mar 11, 1988
Sold by
Kelly Colin and Don Kelly
Bought by
Orr Robert L and Orr Blanche T
Purchase Details
Closed on
Mar 29, 1986
Sold by
Sargent Glenn C
Bought by
Kelly Colin and Don Kelly
Purchase Details
Closed on
Nov 19, 1965
Sold by
Sargent Leona Louise
Bought by
Sargent Glenn C
Purchase Details
Closed on
Jan 1, 1950
Sold by
Sargent Leona Louise
Bought by
Sargent Leona Louise
Purchase Details
Closed on
Jan 1, 1901
Bought by
Sargent Leona Louise
Create a Home Valuation Report for This Property
The Home Valuation Report is an in-depth analysis detailing your home's value as well as a comparison with similar homes in the area
Home Values in the Area
Average Home Value in this Area
Purchase History
| Date | Buyer | Sale Price | Title Company |
|---|---|---|---|
| Morris Mark | $38,500 | -- | |
| Jones Craig A | $30,000 | -- | |
| Hubbard Garland W & Villa S Hubbard | $20,000 | -- | |
| Orr Robert L | -- | -- | |
| Orr Robert L | $12,900 | -- | |
| Orr Robert L | $20,500 | -- | |
| Kelly Colin | $18,000 | -- | |
| Sargent Glenn C | -- | -- | |
| Sargent Leona Louise | -- | -- | |
| Sargent Leona Louise | -- | -- |
Source: Public Records
Tax History Compared to Growth
Tax History
| Year | Tax Paid | Tax Assessment Tax Assessment Total Assessment is a certain percentage of the fair market value that is determined by local assessors to be the total taxable value of land and additions on the property. | Land | Improvement |
|---|---|---|---|---|
| 2024 | $1,068 | $33,108 | $9,396 | $23,712 |
| 2023 | $979 | $29,678 | $8,438 | $21,240 |
| 2022 | $698 | $22,428 | $6,903 | $15,525 |
| 2021 | $655 | $20,646 | $6,903 | $13,743 |
| 2020 | $582 | $18,126 | $5,274 | $12,852 |
| 2019 | $532 | $16,792 | $5,274 | $11,518 |
| 2018 | $506 | $15,934 | $5,274 | $10,660 |
| 2017 | $492 | $15,414 | $5,274 | $10,140 |
| 2016 | $501 | $15,520 | $5,600 | $9,920 |
| 2015 | $465 | $13,760 | $2,480 | $11,280 |
| 2014 | $465 | $14,637 | $2,480 | $12,157 |
Source: Public Records
Map
Nearby Homes
- 27 Oak St NE
- 1 Fir St NE
- 7 Ash St NE
- 0 Cypress St NE Unit 7494593
- 0 Cypress St NE Unit 10422946
- 0 Euclid Ave Unit 10617853
- 104 Earl Ln NE
- 205 Couper St NE
- 411 Woodward St NE
- 313 Woodward St NE
- 2 N Pointe Dr NE
- 219 North Ave NE
- 17 Joplin St NE
- 302 Tolbert St
- 20 Lindberg Dr NE
- 2 Lindberg Dr NE
- 0 Veterans Memorial Hwy NE Unit 10503178
- 0 Veterans Memorial Hwy NE Unit 10565194
- 0 Veterans Memorial Hwy NE Unit 9418044
- 2201 Southern St NE