10 Spruce St Oxford, MA 01540
Estimated Value: $404,296 - $429,000
3
Beds
1
Bath
1,152
Sq Ft
$362/Sq Ft
Est. Value
About This Home
This home is located at 10 Spruce St, Oxford, MA 01540 and is currently estimated at $417,574, approximately $362 per square foot. 10 Spruce St is a home located in Worcester County with nearby schools including Alfred M Chaffee, Oxford High School, and Clara Barton Elementary School.
Ownership History
Date
Name
Owned For
Owner Type
Purchase Details
Closed on
Jul 19, 2012
Sold by
Anderson Gary J
Bought by
Anderson Gary J and Anderson Ryan W
Current Estimated Value
Purchase Details
Closed on
May 24, 2007
Sold by
Anderson Virginia A
Bought by
Anderson Gary J
Home Financials for this Owner
Home Financials are based on the most recent Mortgage that was taken out on this home.
Original Mortgage
$100,333
Interest Rate
6.27%
Create a Home Valuation Report for This Property
The Home Valuation Report is an in-depth analysis detailing your home's value as well as a comparison with similar homes in the area
Home Values in the Area
Average Home Value in this Area
Purchase History
| Date | Buyer | Sale Price | Title Company |
|---|---|---|---|
| Anderson Gary J | -- | -- | |
| Anderson Gary J | -- | -- |
Source: Public Records
Mortgage History
| Date | Status | Borrower | Loan Amount |
|---|---|---|---|
| Previous Owner | Anderson Gary J | $100,333 |
Source: Public Records
Tax History Compared to Growth
Tax History
| Year | Tax Paid | Tax Assessment Tax Assessment Total Assessment is a certain percentage of the fair market value that is determined by local assessors to be the total taxable value of land and additions on the property. | Land | Improvement |
|---|---|---|---|---|
| 2025 | $45 | $354,800 | $85,000 | $269,800 |
| 2024 | $4,225 | $313,400 | $81,100 | $232,300 |
| 2023 | $4,250 | $311,600 | $77,500 | $234,100 |
| 2022 | $3,974 | $245,900 | $76,300 | $169,600 |
| 2021 | $3,696 | $223,600 | $72,400 | $151,200 |
| 2020 | $3,572 | $214,400 | $72,400 | $142,000 |
| 2019 | $3,290 | $193,200 | $72,400 | $120,800 |
| 2018 | $3,103 | $179,700 | $72,400 | $107,300 |
| 2017 | $3,048 | $180,900 | $69,400 | $111,500 |
| 2016 | $3,063 | $180,900 | $69,400 | $111,500 |
| 2015 | $2,856 | $180,900 | $69,400 | $111,500 |
| 2014 | $2,771 | $184,700 | $67,600 | $117,100 |
Source: Public Records
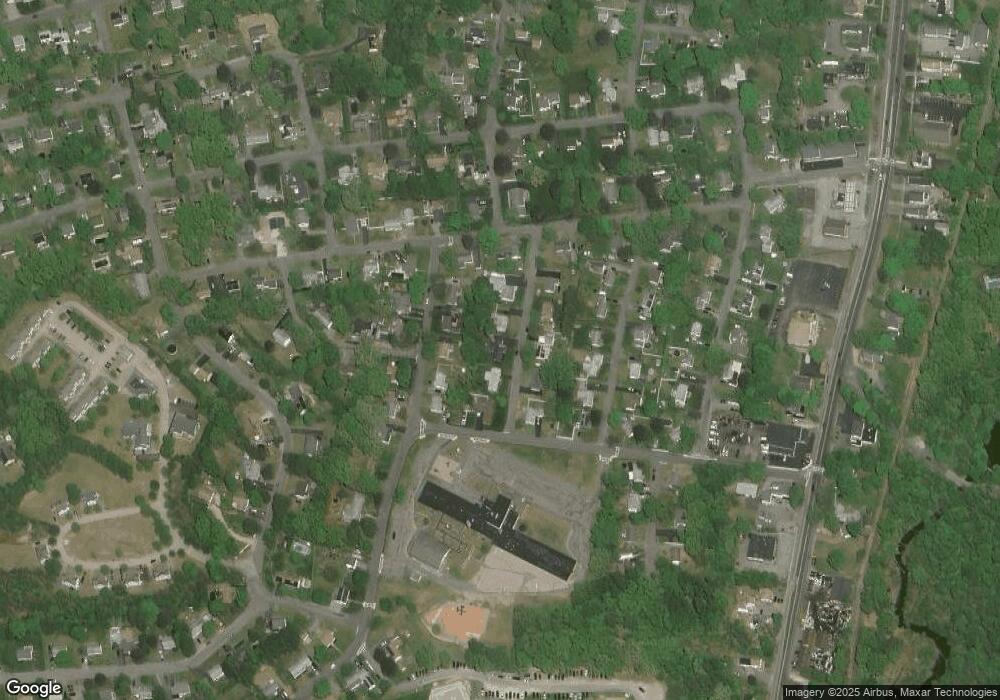
Map
Nearby Homes