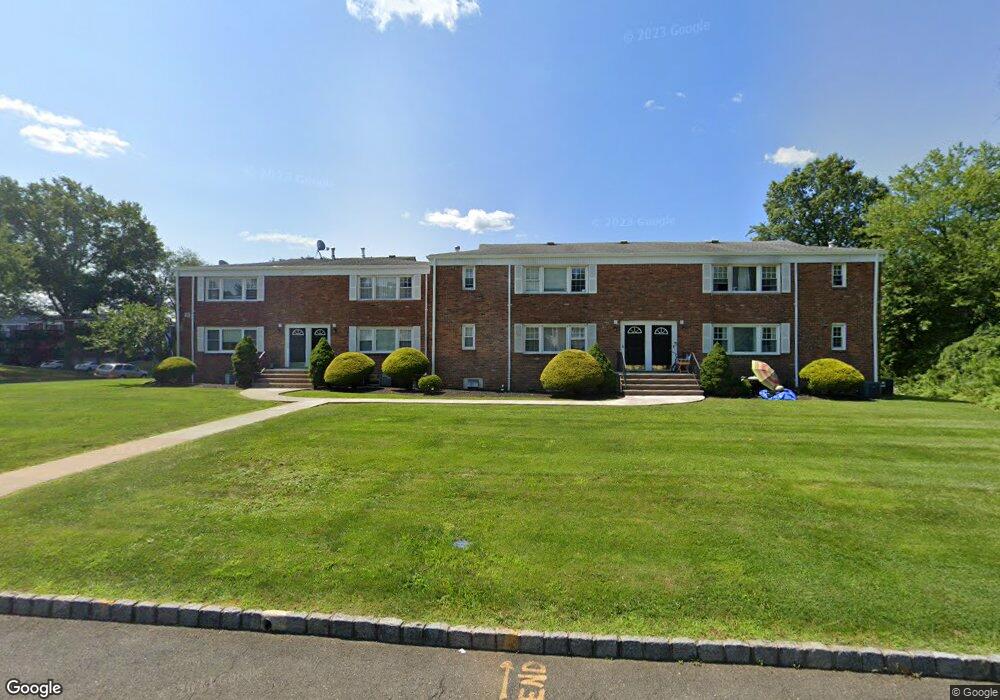
10 Stanford Dr Bridgewater, NJ 08807
Estimated Value: $205,000 - $235,261
--
Bed
--
Bath
730
Sq Ft
$296/Sq Ft
Est. Value
About This Home
This home is located at 10 Stanford Dr, Bridgewater, NJ 08807 and is currently estimated at $216,087, approximately $296 per square foot. 10 Stanford Dr is a home located in Somerset County with nearby schools including Adamsville Primary School, Bridgewater-Raritan Middle School, and Hillside Intermediate School.
Ownership History
Date
Name
Owned For
Owner Type
Purchase Details
Closed on
Jun 1, 2021
Sold by
Lease Unlimited Llc
Bought by
Nrr Consulting Llc
Current Estimated Value
Purchase Details
Closed on
Dec 22, 2016
Sold by
Garg Naveet
Bought by
Lease Unlimited Llc
Home Financials for this Owner
Home Financials are based on the most recent Mortgage that was taken out on this home.
Original Mortgage
$75,000
Interest Rate
4.13%
Mortgage Type
New Conventional
Purchase Details
Closed on
Oct 27, 2016
Sold by
Alvarangea Mauricio
Bought by
Alvarenga Maurico and Lopez Blanca
Home Financials for this Owner
Home Financials are based on the most recent Mortgage that was taken out on this home.
Original Mortgage
$75,000
Interest Rate
4.13%
Mortgage Type
New Conventional
Purchase Details
Closed on
Sep 18, 2015
Sold by
Cornick Gary B
Bought by
Garg Naveet
Purchase Details
Closed on
Dec 4, 2003
Sold by
Arc Investments
Bought by
Maldonado Gloria
Create a Home Valuation Report for This Property
The Home Valuation Report is an in-depth analysis detailing your home's value as well as a comparison with similar homes in the area
Home Values in the Area
Average Home Value in this Area
Purchase History
| Date | Buyer | Sale Price | Title Company |
|---|---|---|---|
| Nrr Consulting Llc | -- | None Available | |
| Nrr Consulting Llc | -- | None Listed On Document | |
| Lease Unlimited Llc | -- | None Available | |
| Alvarenga Maurico | -- | Jesey Cioast Title Ag | |
| Garg Naveet | $91,000 | Madison Title Agency Inc | |
| Maldonado Gloria | $110,200 | -- |
Source: Public Records
Mortgage History
| Date | Status | Borrower | Loan Amount |
|---|---|---|---|
| Previous Owner | Alvarenga Maurico | $75,000 |
Source: Public Records
Tax History Compared to Growth
Tax History
| Year | Tax Paid | Tax Assessment Tax Assessment Total Assessment is a certain percentage of the fair market value that is determined by local assessors to be the total taxable value of land and additions on the property. | Land | Improvement |
|---|---|---|---|---|
| 2025 | $3,335 | $177,000 | $92,000 | $85,000 |
| 2024 | $3,335 | $169,200 | $92,000 | $77,200 |
| 2023 | $3,119 | $155,400 | $92,000 | $63,400 |
| 2022 | $3,060 | $146,700 | $92,000 | $54,700 |
| 2021 | $2,635 | $123,600 | $72,000 | $51,600 |
| 2020 | $2,403 | $112,900 | $62,000 | $50,900 |
| 2019 | $2,405 | $111,900 | $62,000 | $49,900 |
| 2018 | $2,118 | $98,800 | $50,000 | $48,800 |
| 2017 | $2,320 | $108,100 | $60,000 | $48,100 |
| 2016 | $2,282 | $107,900 | $60,000 | $47,900 |
| 2015 | $2,474 | $117,100 | $70,000 | $47,100 |
| 2014 | $2,413 | $112,500 | $70,000 | $42,500 |
Source: Public Records
Map
Nearby Homes
- 7 Columbia Dr Unit 1A
- 124 Chelsea Way
- 8 Columbia Dr Unit 1A
- 90 Chelsea Way
- 15 Dartmouth Ave Unit 3A
- 14 Dartmouth Ave
- 14 Dartmouth Ave Unit 1A
- 18 Dartmouth Ave Unit 1A
- 58 Harry Rd
- 113 N Adamsville Rd
- 51 Marie Ave
- 39 Madison St
- 107 Pearl St
- 20 Monroe St
- 304 Lilac Ct
- 77 Pearl St
- 81 Pearl St
- 76 Pearl St
- 65 Pearl St
- 622 Desota Dr
- 10 Stanford Dr Unit 4
- 10 Stanford Dr Unit 2B
- 10 Stanford Dr
- 10 Stanford Dr
- 10 Stanford Dr
- 10 Stanford Dr
- 10 Stanford Dr
- 10 Stanford Dr
- 10 Stanford Dr
- 10 Stanford Dr Unit 4B
- 10 Stanford Dr Unit 1A
- 10 Stanford Dr Unit 1A
- 10 Stanford Dr Unit 1B
- 10 Stanford Dr Unit 3A
- 10 Stanford Dr Unit 3B
- 2A Columbia Dr
- 3 Dartmouth Ave
- 3 Dartmouth Ave
- 3 Dartmouth Ave
- 3 Dartmouth Ave