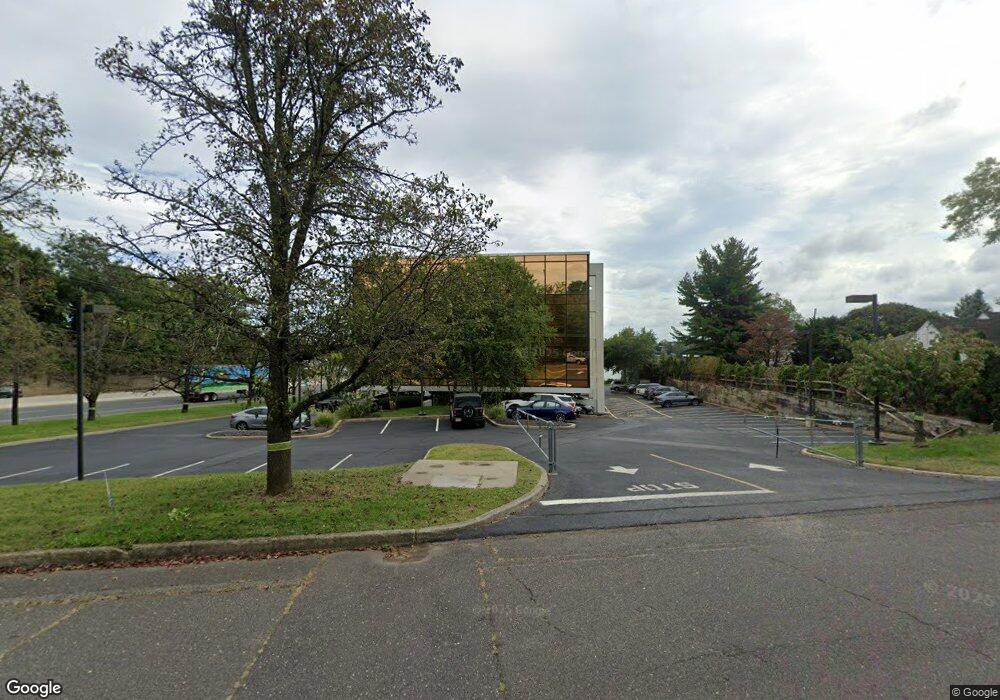
10 State Route 35 Red Bank, NJ 07701
New Monmouth NeighborhoodEstimated Value: $10,724,422
--
Bed
--
Bath
26,760
Sq Ft
$401/Sq Ft
Est. Value
About This Home
This home is located at 10 State Route 35, Red Bank, NJ 07701 and is currently estimated at $10,724,422, approximately $400 per square foot. 10 State Route 35 is a home with nearby schools including River Plaza Elementary School, Thompson Middle School, and Middletown - South High School.
Ownership History
Date
Name
Owned For
Owner Type
Purchase Details
Closed on
May 8, 2008
Sold by
Ipofa Water View Llc
Bought by
Valley National Bank
Current Estimated Value
Purchase Details
Closed on
Aug 14, 2006
Sold by
Water View Offices Llc
Bought by
Ipofa Water View Llc
Purchase Details
Closed on
Sep 8, 1997
Sold by
Pine Brook Co
Bought by
State Of Nj
Purchase Details
Closed on
Sep 14, 1995
Sold by
Pipko Mk Inc
Bought by
K Hovnanian Properties
Purchase Details
Closed on
Feb 1, 1995
Sold by
Rupeikis Richard
Bought by
K Hovnanian Companies
Purchase Details
Closed on
Sep 16, 1994
Sold by
Hovbilt
Bought by
K Hovnanian At Howell
Purchase Details
Closed on
Mar 28, 1994
Sold by
H H P T Holding
Bought by
K Hovnanian At Marlboro
Purchase Details
Closed on
Aug 2, 1993
Sold by
Patterson Donald
Bought by
K Hovnanian At Howell
Create a Home Valuation Report for This Property
The Home Valuation Report is an in-depth analysis detailing your home's value as well as a comparison with similar homes in the area
Home Values in the Area
Average Home Value in this Area
Purchase History
| Date | Buyer | Sale Price | Title Company |
|---|---|---|---|
| Valley National Bank | $30,000 | None Available | |
| Ipofa Water View Llc | $6,100,000 | -- | |
| State Of Nj | $2,500 | -- | |
| K Hovnanian Properties | $1,000,000 | -- | |
| K Hovnanian Companies | $225,000 | -- | |
| K Hovnanian At Howell | $737,500 | -- | |
| K Hovnanian At Marlboro | $2,562,315 | -- | |
| K Hovnanian At Howell | $3,125,000 | -- |
Source: Public Records
Tax History Compared to Growth
Tax History
| Year | Tax Paid | Tax Assessment Tax Assessment Total Assessment is a certain percentage of the fair market value that is determined by local assessors to be the total taxable value of land and additions on the property. | Land | Improvement |
|---|---|---|---|---|
| 2025 | $74,017 | $4,590,800 | $1,575,000 | $3,015,800 |
| 2024 | $90,529 | $4,499,500 | $1,560,000 | $2,939,500 |
| 2023 | $90,529 | $5,208,800 | $1,500,000 | $3,708,800 |
| 2022 | $99,422 | $4,889,200 | $1,500,000 | $3,389,200 |
| 2021 | $99,422 | $4,779,900 | $1,500,000 | $3,279,900 |
| 2020 | $102,863 | $4,811,200 | $1,500,000 | $3,311,200 |
| 2019 | $101,072 | $4,785,600 | $1,500,000 | $3,285,600 |
| 2018 | $86,680 | $4,000,000 | $1,500,000 | $2,500,000 |
| 2017 | $87,560 | $4,000,000 | $1,500,000 | $2,500,000 |
| 2016 | $63,930 | $3,000,000 | $1,500,000 | $1,500,000 |
| 2015 | $64,080 | $3,000,000 | $1,500,000 | $1,500,000 |
| 2014 | $87,560 | $4,000,000 | $2,850,000 | $1,150,000 |
Source: Public Records
Map
Nearby Homes
- 79 Lake Shore Dr
- 67 Victoria Place
- 130 Bodman Place Unit 15
- 130 Bodman Place Unit 8
- 8 Cherry St
- 390 Conover Place
- 398 Conover Place
- 233 Conover Ln
- 51 Blossom Cove Rd
- 28 Riverside Ave Unit 2G
- 28 Riverside Ave Unit 4g
- 28 Riverside Ave Unit 10h
- 28 Riverside Ave Unit 1G
- 928 Park Place
- 839 Arthur Dr
- 833 Lincoln St
- 13 Applegate St
- 4 Boat Club Ct Unit 3E
- 126 Manchester Ct
- 44 Monroe St
- 119 Crescent Dr
- 20 Lake Shore Dr
- 118 Crescent Dr
- 139 Crescent Dr
- 26 Lake Shore Dr
- 6 Conover Ln
- 136 Crescent Dr
- 120 Crescent Dr
- 130 Crescent Dr
- 12 Conover Ln
- 15 Lake Shore Dr
- 23 Lake Shore Dr
- 29 Lake Shore Dr
- 3 Lincoln Place
- 18 Conover Ln
- 48 Lake Shore Dr
- 5 Lincoln Cir E
- 5 Lincoln Cir E
- 7 Conover Ln
- 43 Lake Shore Dr