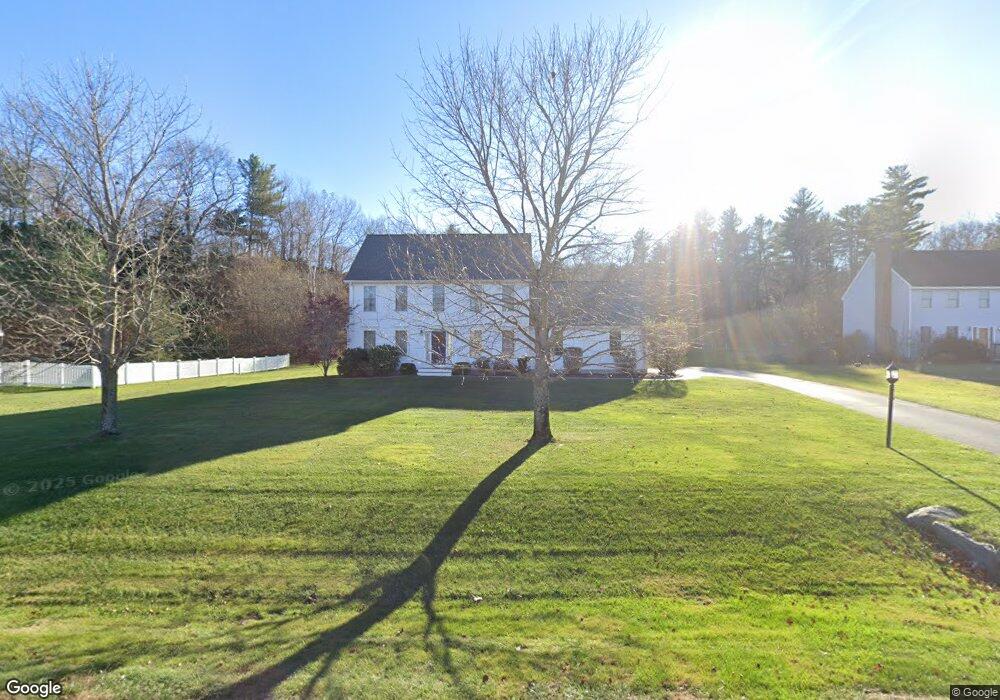
10 Stephen Dr Stratham, NH 03885
Estimated Value: $829,360 - $1,023,000
3
Beds
3
Baths
2,712
Sq Ft
$327/Sq Ft
Est. Value
About This Home
This home is located at 10 Stephen Dr, Stratham, NH 03885 and is currently estimated at $886,590, approximately $326 per square foot. 10 Stephen Dr is a home located in Rockingham County with nearby schools including Stratham Memorial School, Cooperative Middle School, and Exeter High School.
Ownership History
Date
Name
Owned For
Owner Type
Purchase Details
Closed on
Mar 2, 2023
Sold by
Schnobrich Scott D and Schnobrich Rebecca L
Bought by
Schnobrich Ft
Current Estimated Value
Purchase Details
Closed on
May 15, 2000
Sold by
Scamman James I
Bought by
Schnobrich Scott D and Schnobrich Rebecca L
Home Financials for this Owner
Home Financials are based on the most recent Mortgage that was taken out on this home.
Original Mortgage
$145,000
Interest Rate
8.21%
Create a Home Valuation Report for This Property
The Home Valuation Report is an in-depth analysis detailing your home's value as well as a comparison with similar homes in the area
Home Values in the Area
Average Home Value in this Area
Purchase History
| Date | Buyer | Sale Price | Title Company |
|---|---|---|---|
| Schnobrich Ft | -- | None Available | |
| Schnobrich Scott D | $243,700 | -- |
Source: Public Records
Mortgage History
| Date | Status | Borrower | Loan Amount |
|---|---|---|---|
| Previous Owner | Schnobrich Scott D | $113,000 | |
| Previous Owner | Schnobrich Scott D | $150,000 | |
| Previous Owner | Schnobrich Scott D | $25,000 | |
| Previous Owner | Schnobrich Scott D | $145,000 |
Source: Public Records
Tax History
| Year | Tax Paid | Tax Assessment Tax Assessment Total Assessment is a certain percentage of the fair market value that is determined by local assessors to be the total taxable value of land and additions on the property. | Land | Improvement |
|---|---|---|---|---|
| 2025 | $10,673 | $789,400 | $363,400 | $426,000 |
| 2024 | $10,311 | $785,900 | $363,400 | $422,500 |
| 2023 | $10,164 | $486,100 | $187,200 | $298,900 |
| 2022 | $9,095 | $486,100 | $187,200 | $298,900 |
| 2021 | $9,003 | $486,100 | $187,200 | $298,900 |
| 2020 | $9,212 | $486,100 | $187,200 | $298,900 |
| 2019 | $9,056 | $486,100 | $187,200 | $298,900 |
| 2018 | $7,883 | $375,400 | $124,500 | $250,900 |
| 2017 | $7,621 | $375,400 | $124,500 | $250,900 |
| 2016 | $23,414 | $375,400 | $124,500 | $250,900 |
| 2015 | $7,470 | $375,400 | $124,500 | $250,900 |
| 2014 | $7,474 | $375,400 | $124,500 | $250,900 |
| 2013 | $7,245 | $368,700 | $135,800 | $232,900 |
Source: Public Records
Map
Nearby Homes
- 23 Winding Brook Dr
- 63 Peninsula Dr
- 8 Muirfield Dr
- 8 Cider Mill Ln
- 32 Tansy Ave
- 31 Pinewood Dr
- 99 Winnicutt Rd Unit 6
- 10 Wingate Ct
- 10 Heron Way
- 222 Portsmouth Ave
- 227 Portsmouth Ave
- 74 College Rd
- 9 Captain's Way
- 10 Thornhill Rd
- 85 College Rd
- 1 Jason Dr
- 182 Winnicutt Rd
- 34 Kinloch Dr
- Homesite 2 Windsong Place
- 120 Exeter Rd
Your Personal Tour Guide
Ask me questions while you tour the home.