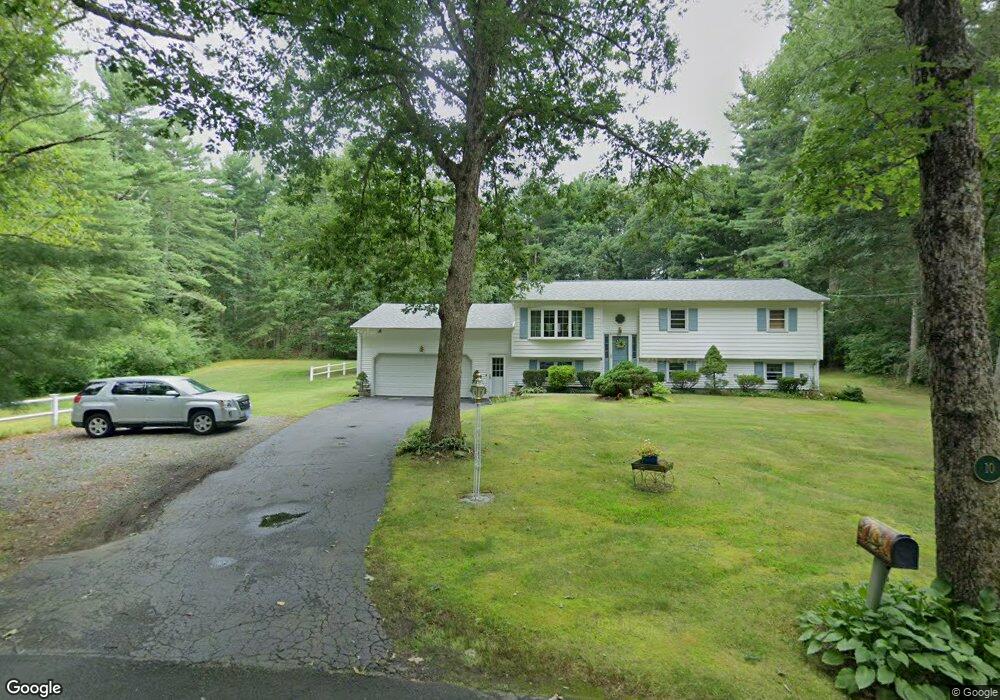
10 Stuart Dr Coventry, RI 02816
Estimated Value: $409,000 - $553,000
4
Beds
2
Baths
1,138
Sq Ft
$422/Sq Ft
Est. Value
About This Home
This home is located at 10 Stuart Dr, Coventry, RI 02816 and is currently estimated at $479,676, approximately $421 per square foot. 10 Stuart Dr is a home located in Kent County with nearby schools including Alan Shawn Feinstein Ms Of Cov, Coventry High School, and Greenwich Village School.
Ownership History
Date
Name
Owned For
Owner Type
Purchase Details
Closed on
Nov 18, 2014
Sold by
Roche Robert E and Roche Elaine
Bought by
Roche Ft
Current Estimated Value
Purchase Details
Closed on
Sep 5, 1991
Sold by
Carlow Everett
Bought by
Roche Robert
Create a Home Valuation Report for This Property
The Home Valuation Report is an in-depth analysis detailing your home's value as well as a comparison with similar homes in the area
Purchase History
| Date | Buyer | Sale Price | Title Company |
|---|---|---|---|
| Roche Ft | -- | -- | |
| Roche Robert | $146,000 | -- |
Source: Public Records
Mortgage History
| Date | Status | Borrower | Loan Amount |
|---|---|---|---|
| Previous Owner | Roche Robert | $161,000 | |
| Previous Owner | Roche Robert | $76,000 | |
| Previous Owner | Roche Robert | $20,000 | |
| Previous Owner | Roche Robert | $108,500 |
Source: Public Records
Tax History
| Year | Tax Paid | Tax Assessment Tax Assessment Total Assessment is a certain percentage of the fair market value that is determined by local assessors to be the total taxable value of land and additions on the property. | Land | Improvement |
|---|---|---|---|---|
| 2025 | $5,770 | $358,600 | $124,800 | $233,800 |
| 2024 | $5,680 | $358,600 | $124,800 | $233,800 |
| 2023 | $5,497 | $358,600 | $124,800 | $233,800 |
| 2022 | $5,495 | $280,800 | $112,000 | $168,800 |
| 2021 | $5,448 | $280,800 | $112,000 | $168,800 |
| 2020 | $6,245 | $280,800 | $112,000 | $168,800 |
| 2019 | $5,193 | $233,500 | $96,000 | $137,500 |
| 2018 | $5,046 | $233,500 | $96,000 | $137,500 |
| 2017 | $4,899 | $233,500 | $96,000 | $137,500 |
| 2016 | $4,999 | $233,500 | $90,900 | $142,600 |
| 2015 | $4,864 | $233,500 | $90,900 | $142,600 |
| 2014 | $4,452 | $233,500 | $90,900 | $142,600 |
| 2013 | $4,602 | $246,600 | $104,900 | $141,700 |
Source: Public Records
Map
Nearby Homes
- 4 Boyd Brook Cir
- 4 Pine Way Blvd
- 67 Linda Dr
- 4 Ln 3
- 14 Pine Way Blvd
- 84 Linda Dr
- 6 Ln 1
- 53 Park Ln
- 0 Nooseneck Hill Rd Unit 1404632
- 40 Leisure Way
- 15 Friar Tuck Ln
- 4 Leisure Way
- 24 Sherwood Valley Ln
- 9 Sherwood Valley Ln
- 10 Sherwood Valley Ln
- 5 Circlewood Dr
- 8 Pine Way Blvd
- 16 Pine Way Blvd
- 2 Pine Way Blvd
- 25 Hill Farm Camp Rd
Your Personal Tour Guide
Ask me questions while you tour the home.