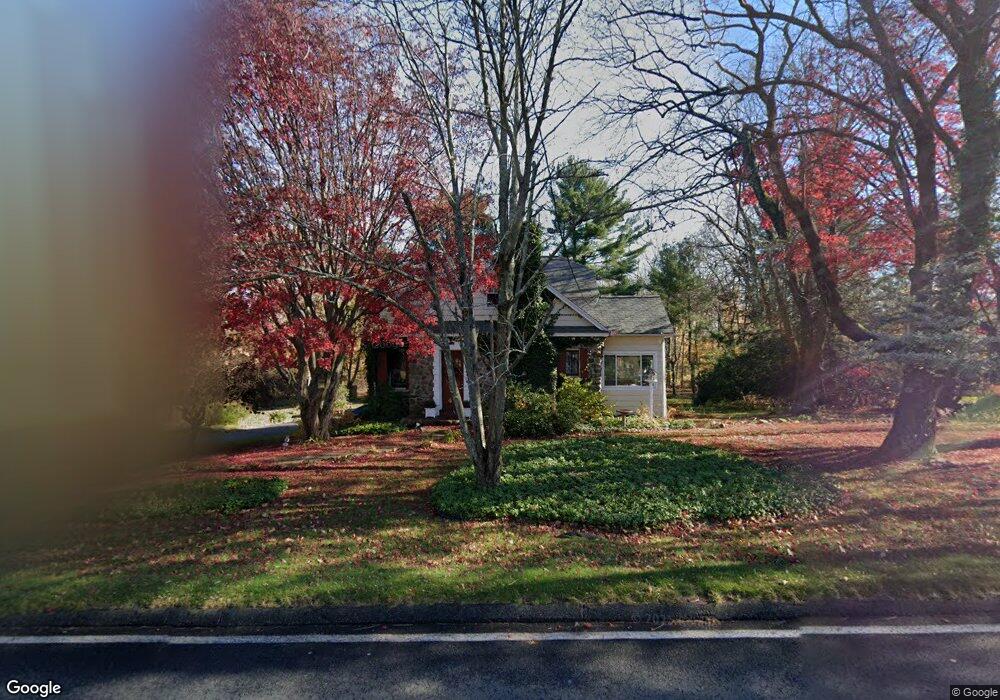
10 Summit Rd Prospect, CT 06712
Estimated Value: $378,000 - $556,000
3
Beds
3
Baths
1,816
Sq Ft
$259/Sq Ft
Est. Value
About This Home
This home is located at 10 Summit Rd, Prospect, CT 06712 and is currently estimated at $470,432, approximately $259 per square foot. 10 Summit Rd is a home located in New Haven County with nearby schools including Prospect Elementary School, Long River Middle School, and Woodland Regional High School.
Ownership History
Date
Name
Owned For
Owner Type
Purchase Details
Closed on
Jul 2, 2003
Sold by
Oleary Thomas F
Bought by
Lamaine Christopher and Benedetto Amy
Current Estimated Value
Purchase Details
Closed on
Apr 16, 2002
Sold by
Pelosi Chris A and Pelosi Kelly R
Bought by
Oleary Thomas F
Purchase Details
Closed on
Mar 30, 2001
Sold by
Jones George A
Bought by
Pelosi Chris A and Pelosi Kelly R
Purchase Details
Closed on
Dec 28, 1998
Sold by
Jones George R
Bought by
Jones George A
Create a Home Valuation Report for This Property
The Home Valuation Report is an in-depth analysis detailing your home's value as well as a comparison with similar homes in the area
Home Values in the Area
Average Home Value in this Area
Purchase History
| Date | Buyer | Sale Price | Title Company |
|---|---|---|---|
| Lamaine Christopher | $329,000 | -- | |
| Oleary Thomas F | $299,900 | -- | |
| Pelosi Chris A | $250,000 | -- | |
| Jones George A | $65,000 | -- |
Source: Public Records
Mortgage History
| Date | Status | Borrower | Loan Amount |
|---|---|---|---|
| Open | Jones George A | $20,000 | |
| Open | Jones George A | $232,000 |
Source: Public Records
Tax History
| Year | Tax Paid | Tax Assessment Tax Assessment Total Assessment is a certain percentage of the fair market value that is determined by local assessors to be the total taxable value of land and additions on the property. | Land | Improvement |
|---|---|---|---|---|
| 2025 | $5,976 | $233,730 | $80,640 | $153,090 |
| 2024 | $5,437 | $169,160 | $80,650 | $88,510 |
| 2023 | $5,400 | $169,160 | $80,650 | $88,510 |
| 2022 | $5,405 | $169,160 | $80,650 | $88,510 |
| 2021 | $5,464 | $169,160 | $80,650 | $88,510 |
| 2020 | $5,225 | $165,350 | $80,650 | $84,700 |
| 2019 | $5,118 | $165,350 | $80,650 | $84,700 |
| 2018 | $5,126 | $165,350 | $80,650 | $84,700 |
| 2017 | $5,167 | $165,350 | $80,650 | $84,700 |
| 2016 | $4,946 | $165,350 | $80,650 | $84,700 |
| 2015 | $4,887 | $167,180 | $80,660 | $86,520 |
| 2014 | $4,845 | $167,180 | $80,660 | $86,520 |
Source: Public Records
Map
Nearby Homes
- 6 Holley Ln
- 20 Hydelor Ave
- 66 Union City Rd
- 9 Melissa Ln
- 4 Alison Ct
- 44 Cheshire Rd
- 24 Rozum Cir
- 17 White Oak Dr Unit 17
- 9 Cheryl Ln
- 11 Poplar Dr Unit 11
- 6 Saunders Ln
- 156 Mikayla Ln
- 152 Summit Rd
- 125 Salem Rd
- 104 Cherry Cir Unit 104
- 26 Spruce Dr
- 43 Bateswood Rd
- 45 Westbrook Dr
- 519 Scott Rd Unit 58
- 46 Bracewood Rd
Your Personal Tour Guide
Ask me questions while you tour the home.