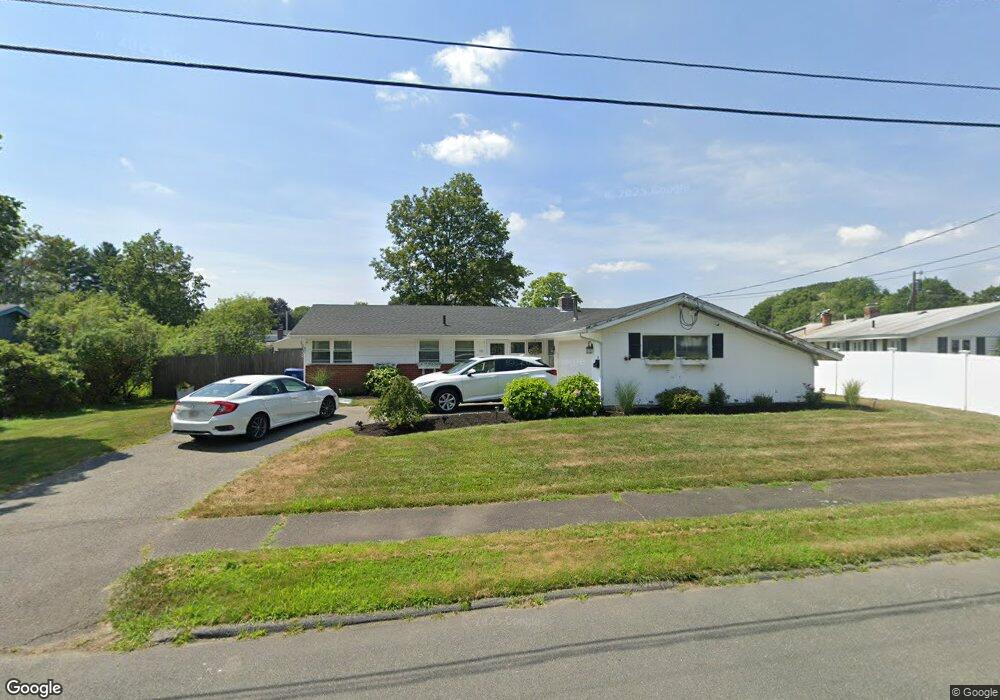
10 Sycamore St Danvers, MA 01923
Estimated Value: $619,000 - $697,000
3
Beds
2
Baths
1,248
Sq Ft
$536/Sq Ft
Est. Value
About This Home
This home is located at 10 Sycamore St, Danvers, MA 01923 and is currently estimated at $669,058, approximately $536 per square foot. 10 Sycamore St is a home located in Essex County with nearby schools including Danvers High School, St. Mary of the Annunciation School, and St. John's Prep.
Ownership History
Date
Name
Owned For
Owner Type
Purchase Details
Closed on
Feb 8, 2010
Sold by
Hill Judith Ann and Godin Paul Richard
Bought by
Marrero Paula J
Current Estimated Value
Home Financials for this Owner
Home Financials are based on the most recent Mortgage that was taken out on this home.
Original Mortgage
$284,747
Interest Rate
5.5%
Mortgage Type
FHA
Purchase Details
Closed on
Jun 30, 2008
Sold by
Godin Richard E Est
Bought by
Godin Paul Richard
Purchase Details
Closed on
Jan 23, 2007
Sold by
Godin Eleanor M and Godin Richard E
Bought by
Godin Richard E
Create a Home Valuation Report for This Property
The Home Valuation Report is an in-depth analysis detailing your home's value as well as a comparison with similar homes in the area
Home Values in the Area
Average Home Value in this Area
Purchase History
| Date | Buyer | Sale Price | Title Company |
|---|---|---|---|
| Marrero Paula J | $290,000 | -- | |
| Godin Paul Richard | -- | -- | |
| Godin Richard E | -- | -- |
Source: Public Records
Mortgage History
| Date | Status | Borrower | Loan Amount |
|---|---|---|---|
| Open | Godin Richard E | $281,778 | |
| Closed | Godin Richard E | $284,747 |
Source: Public Records
Tax History Compared to Growth
Tax History
| Year | Tax Paid | Tax Assessment Tax Assessment Total Assessment is a certain percentage of the fair market value that is determined by local assessors to be the total taxable value of land and additions on the property. | Land | Improvement |
|---|---|---|---|---|
| 2025 | $5,977 | $543,900 | $342,000 | $201,900 |
| 2024 | $5,935 | $534,200 | $342,000 | $192,200 |
| 2023 | $5,783 | $492,200 | $310,800 | $181,400 |
| 2022 | $5,667 | $447,600 | $282,000 | $165,600 |
| 2021 | $5,447 | $408,000 | $267,200 | $140,800 |
| 2020 | $5,287 | $404,800 | $264,000 | $140,800 |
| 2019 | $5,057 | $380,800 | $240,000 | $140,800 |
| 2018 | $4,918 | $363,200 | $237,600 | $125,600 |
| 2017 | $4,705 | $331,600 | $207,600 | $124,000 |
| 2016 | $4,491 | $316,300 | $198,000 | $118,300 |
| 2015 | $4,278 | $286,900 | $180,000 | $106,900 |
Source: Public Records
Map
Nearby Homes
- 42 Coolidge Rd
- 12 Central Ave Unit 1
- 35 Locust St Unit 3
- 38 High St Unit 4
- 4 Butler Ave
- 7 Riverbank Ave Unit 7
- 7 Riverbank Ave
- 35 High St Unit 3D
- 6 Bartlett Rd
- 12 Exeter St
- 14 Williams St Unit C17
- 39 Roosevelt Ave
- 6 Kimberly Dr
- 108 Abington Rd Unit 108
- 6 Colby Rd
- 2 Duck Pond Rd Unit 108
- 63 Adams St
- 57 Adams St
- 59 Riverview Ave
- 508 Elliott St