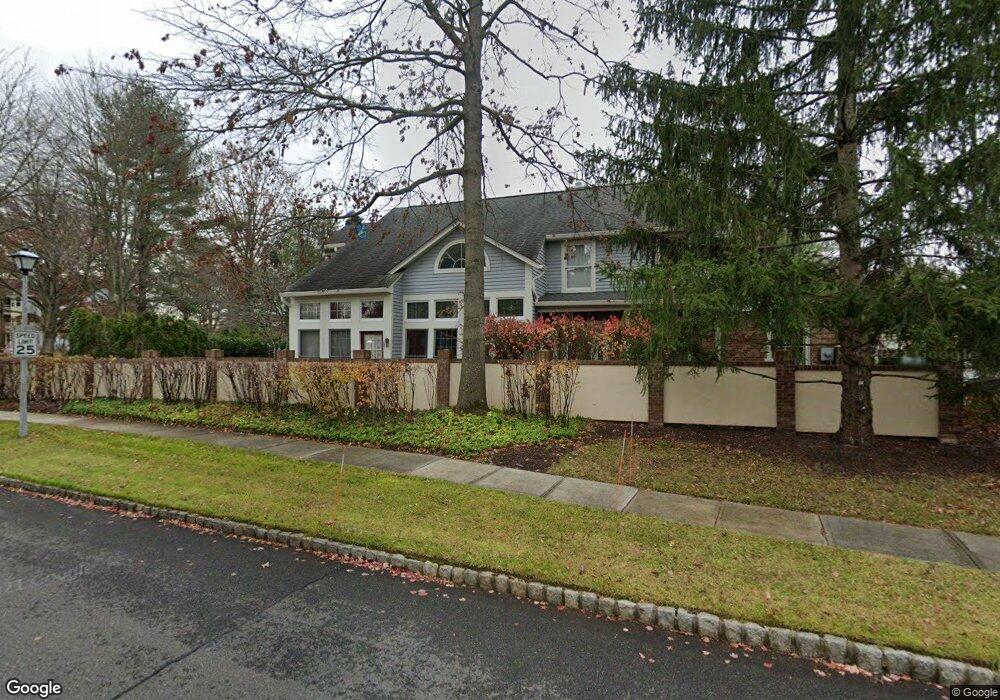
10 Thorngate Ct Princeton, NJ 08540
Estimated Value: $731,000 - $884,000
--
Bed
--
Bath
2,352
Sq Ft
$353/Sq Ft
Est. Value
About This Home
This home is located at 10 Thorngate Ct, Princeton, NJ 08540 and is currently estimated at $830,550, approximately $353 per square foot. 10 Thorngate Ct is a home located in Mercer County with nearby schools including Maurice Hawk Elementary School, Village Elementary School, and Thomas R. Grover Middle School.
Ownership History
Date
Name
Owned For
Owner Type
Purchase Details
Closed on
Jul 23, 2004
Sold by
Bazemore Cleveland
Bought by
Corrado Barbara
Current Estimated Value
Purchase Details
Closed on
May 30, 2003
Sold by
Feinblatt Joel
Bought by
Bazemore Cleveland and Bazemore Lisa
Home Financials for this Owner
Home Financials are based on the most recent Mortgage that was taken out on this home.
Original Mortgage
$364,500
Interest Rate
5.45%
Purchase Details
Closed on
Jul 31, 1997
Sold by
Leghorn Timothy
Bought by
Feinblatt Uoel and Feinblatt Roberta
Home Financials for this Owner
Home Financials are based on the most recent Mortgage that was taken out on this home.
Original Mortgage
$180,000
Interest Rate
7.48%
Purchase Details
Closed on
Apr 19, 1991
Sold by
Canal Pointe Associates Inc
Bought by
Leghorn Timothy E and Leghorn Carol
Create a Home Valuation Report for This Property
The Home Valuation Report is an in-depth analysis detailing your home's value as well as a comparison with similar homes in the area
Home Values in the Area
Average Home Value in this Area
Purchase History
| Date | Buyer | Sale Price | Title Company |
|---|---|---|---|
| Corrado Barbara | $465,000 | -- | |
| Bazemore Cleveland | $405,000 | -- | |
| Feinblatt Uoel | $243,000 | -- | |
| Leghorn Timothy E | $180,000 | -- |
Source: Public Records
Mortgage History
| Date | Status | Borrower | Loan Amount |
|---|---|---|---|
| Previous Owner | Bazemore Cleveland | $364,500 | |
| Previous Owner | Feinblatt Uoel | $180,000 |
Source: Public Records
Tax History Compared to Growth
Tax History
| Year | Tax Paid | Tax Assessment Tax Assessment Total Assessment is a certain percentage of the fair market value that is determined by local assessors to be the total taxable value of land and additions on the property. | Land | Improvement |
|---|---|---|---|---|
| 2025 | $15,126 | $493,500 | $155,000 | $338,500 |
| 2024 | $14,494 | $493,500 | $155,000 | $338,500 |
| 2023 | $14,494 | $493,500 | $155,000 | $338,500 |
| 2022 | $14,213 | $493,500 | $155,000 | $338,500 |
| 2021 | $14,094 | $493,500 | $155,000 | $338,500 |
| 2020 | $13,838 | $493,500 | $155,000 | $338,500 |
| 2019 | $13,680 | $493,500 | $155,000 | $338,500 |
| 2018 | $13,552 | $493,500 | $155,000 | $338,500 |
| 2017 | $13,270 | $493,500 | $155,000 | $338,500 |
| 2016 | $12,984 | $493,500 | $155,000 | $338,500 |
| 2015 | $12,683 | $493,500 | $155,000 | $338,500 |
| 2014 | $12,535 | $493,500 | $155,000 | $338,500 |
Source: Public Records
Map
Nearby Homes
- 9 Cromwell Ct
- 304 Trinity Ct Unit 11
- 202 Salem Ct Unit 2
- 14 Kensington Ct
- 110 Biscayne Ct Unit 11
- 107 Lassen Ct
- 107 Lassen Ct Unit 3
- 18108 Donatello Dr Unit 1881
- 11105 Donatello Dr
- 18105 Donatello Dr Unit 1851
- 9104 Rossini Dr
- 18103 Donatello Dr Unit 1831
- 9104 Rossini Dr Unit 941
- 9202 Rossini Dr
- 18201 Donatello Dr
- 9202 Rossini Dr Unit 962
- Norah Plan at Meridian Walk at Princeton
- 6105 Vivaldi Rd
- 15102 Donatello Dr
- 18201 Donatello Dr Unit 1812
- 9 Thorngate Ct
- 12 Thorngate Ct Unit 545
- 8 Thorngate Ct
- 1 Thorngate Ct
- 3 Thorngate Ct
- 2 Thorngate Ct Unit 555
- 7 Thorngate Ct
- 4 Thorngate Ct
- 6 Thorngate Ct
- 5 Thorngate Ct
- 1 Cromwell Ct
- 121 Commonwealth Ct Unit 2
- 121 Commonwealth Ct Unit 3
- 121 Commonwealth Ct Unit 10
- 121 Commonwealth Ct Unit 6
- 121 Commonwealth Ct Unit 4
- 121 Commonwealth Ct Unit 5
- 121 Commonwealth Ct Unit 9
- 121 Commonwealth Ct Unit 8
- 121 Commonwealth Ct Unit 12