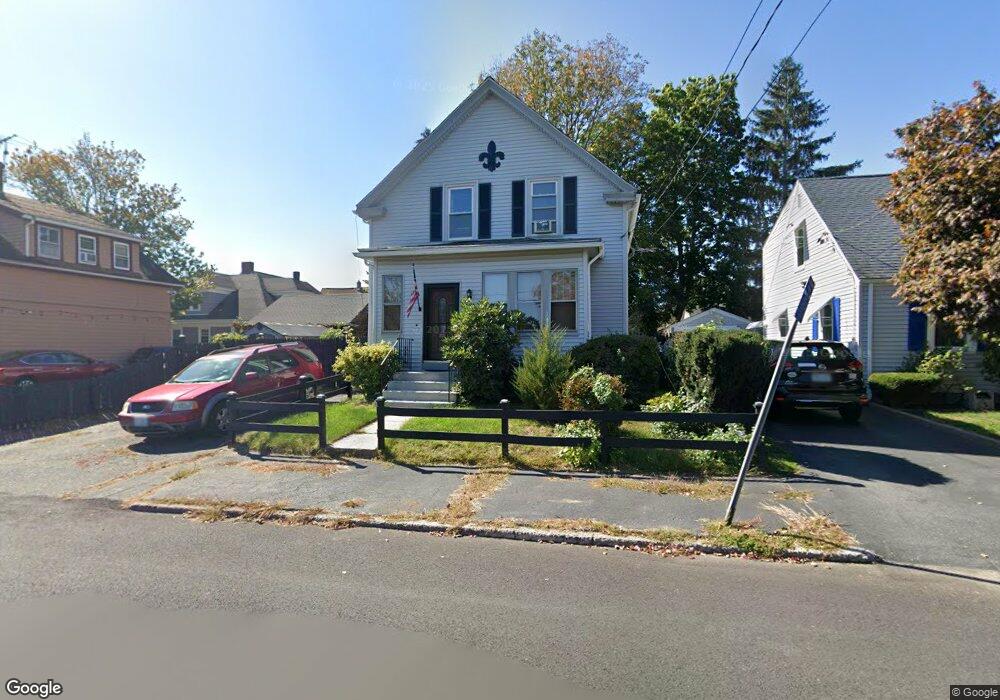
10 Thurber St Pawtucket, RI 02861
Darlington NeighborhoodEstimated Value: $392,000 - $432,000
3
Beds
1
Bath
1,322
Sq Ft
$308/Sq Ft
Est. Value
About This Home
This home is located at 10 Thurber St, Pawtucket, RI 02861 and is currently estimated at $407,796, approximately $308 per square foot. 10 Thurber St is a home located in Providence County with nearby schools including St Cecilia School and Dayspring Christian Academy.
Ownership History
Date
Name
Owned For
Owner Type
Purchase Details
Closed on
Mar 6, 2008
Sold by
Mckitchen Carolyn S
Bought by
Rocheleau Raymond and Rocheleau Paulette
Current Estimated Value
Home Financials for this Owner
Home Financials are based on the most recent Mortgage that was taken out on this home.
Original Mortgage
$200,265
Outstanding Balance
$123,620
Interest Rate
5.57%
Mortgage Type
Purchase Money Mortgage
Estimated Equity
$284,176
Create a Home Valuation Report for This Property
The Home Valuation Report is an in-depth analysis detailing your home's value as well as a comparison with similar homes in the area
Home Values in the Area
Average Home Value in this Area
Purchase History
| Date | Buyer | Sale Price | Title Company |
|---|---|---|---|
| Rocheleau Raymond | $195,000 | -- |
Source: Public Records
Mortgage History
| Date | Status | Borrower | Loan Amount |
|---|---|---|---|
| Open | Rocheleau Raymond | $200,265 |
Source: Public Records
Tax History Compared to Growth
Tax History
| Year | Tax Paid | Tax Assessment Tax Assessment Total Assessment is a certain percentage of the fair market value that is determined by local assessors to be the total taxable value of land and additions on the property. | Land | Improvement |
|---|---|---|---|---|
| 2024 | $3,908 | $316,700 | $145,600 | $171,100 |
| 2023 | $3,876 | $228,800 | $89,000 | $139,800 |
| 2022 | $3,794 | $228,800 | $89,000 | $139,800 |
| 2021 | $3,794 | $228,800 | $89,000 | $139,800 |
| 2020 | $3,305 | $158,200 | $77,500 | $80,700 |
| 2019 | $3,305 | $158,200 | $77,500 | $80,700 |
| 2018 | $3,185 | $158,200 | $77,500 | $80,700 |
| 2017 | $3,060 | $134,700 | $70,200 | $64,500 |
| 2016 | $2,949 | $134,700 | $70,200 | $64,500 |
| 2015 | $2,949 | $134,700 | $70,200 | $64,500 |
| 2014 | $2,601 | $112,800 | $58,500 | $54,300 |
Source: Public Records
Map
Nearby Homes
- 877 Central Ave
- 103 Clews St
- 133 Hanover Ave
- 52 Lanesboro St
- 41 Calder St
- 15 Archer St
- 51 Hanover Ave
- 142 London Ave
- 34 Wasaga Rd
- 79 Archer St
- 76 Case Ave Unit 76
- 1167 Newport Ave
- 79 Central Ave
- 3 Lindesta Rd
- 22 London Ave
- 139 Tweed St
- 97 Wendell St
- 127 Ricard St
- 660 Cottage St Unit 6
- 304 Hughes Ave