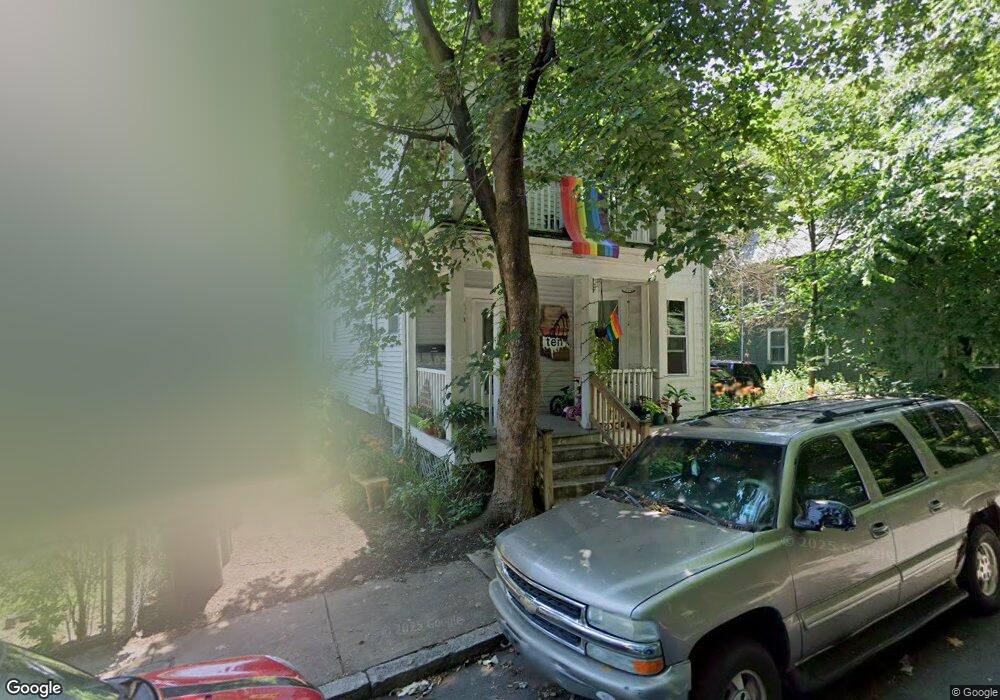
10 Thwing St Unit 1 Roxbury, MA 02119
Fort Hill NeighborhoodEstimated Value: $465,000 - $673,000
2
Beds
1
Bath
850
Sq Ft
$627/Sq Ft
Est. Value
About This Home
This home is located at 10 Thwing St Unit 1, Roxbury, MA 02119 and is currently estimated at $533,075, approximately $627 per square foot. 10 Thwing St Unit 1 is a home located in Suffolk County with nearby schools including City on a Hill Charter Public School and Paige Academy.
Ownership History
Date
Name
Owned For
Owner Type
Purchase Details
Closed on
Sep 16, 2008
Sold by
10 Thwing Street Rt
Bought by
Conan Cyrille
Current Estimated Value
Home Financials for this Owner
Home Financials are based on the most recent Mortgage that was taken out on this home.
Original Mortgage
$193,500
Outstanding Balance
$129,073
Interest Rate
6.58%
Mortgage Type
Purchase Money Mortgage
Estimated Equity
$404,002
Create a Home Valuation Report for This Property
The Home Valuation Report is an in-depth analysis detailing your home's value as well as a comparison with similar homes in the area
Home Values in the Area
Average Home Value in this Area
Purchase History
| Date | Buyer | Sale Price | Title Company |
|---|---|---|---|
| Conan Cyrille | $210,000 | -- |
Source: Public Records
Mortgage History
| Date | Status | Borrower | Loan Amount |
|---|---|---|---|
| Open | Conan Cyrille | $193,500 |
Source: Public Records
Tax History Compared to Growth
Tax History
| Year | Tax Paid | Tax Assessment Tax Assessment Total Assessment is a certain percentage of the fair market value that is determined by local assessors to be the total taxable value of land and additions on the property. | Land | Improvement |
|---|---|---|---|---|
| 2025 | $5,564 | $480,500 | $0 | $480,500 |
| 2024 | $4,980 | $456,900 | $0 | $456,900 |
| 2023 | $4,762 | $443,400 | $0 | $443,400 |
| 2022 | $4,595 | $422,300 | $0 | $422,300 |
| 2021 | $4,506 | $422,300 | $0 | $422,300 |
| 2020 | $4,612 | $436,700 | $0 | $436,700 |
| 2019 | $4,261 | $404,300 | $0 | $404,300 |
| 2018 | $3,925 | $374,500 | $0 | $374,500 |
| 2017 | $3,705 | $349,900 | $0 | $349,900 |
| 2016 | $3,564 | $324,000 | $0 | $324,000 |
| 2015 | $3,258 | $269,000 | $0 | $269,000 |
| 2014 | $3,102 | $246,600 | $0 | $246,600 |
Source: Public Records
Map
Nearby Homes
- 63 Beech Glen St
- 51 Beech Glen St Unit 3
- 4 Fort Ave Unit 2
- 9-45 Vale St
- 59 Fort Ave
- 2856 Washington St
- 8 Brinton St Unit 2
- 9 W Cedar St Unit 1
- 31 Dorr St
- 10 Linwood St
- 38 Juniper St
- 16 Mayfair St
- 35-37 Notre Dame St
- 26-28-30 Notre Dame St
- 49 Norfolk St
- 22 Fisher Ave
- 90 Munroe St
- 64 Alpine St Unit 104
- 64 Alpine St Unit 304
- 249 Roxbury St Unit 1
- 10 Thwing St Unit 2
- 8 Thwing St
- 12 Thwing St
- 6 Thwing St
- 14 Thwing St Unit 2
- 14 Thwing St Unit 1
- 14 Thwing St
- 4 Thwing St
- 65 Beech Glen St
- 65 Beech Glen St Unit 65CP
- 65 Beech Glen St Unit B
- 65 Beech Glen St Unit S
- 65 Beech Glen St Unit 65 Beech Glen
- 65 Beech Glen St
- 65 Beech Glen St Unit 1
- 65 Beech Glen St Unit 2
- 7 Thwing St
- 16 Thwing St
- 219 Highland St
- 219 Highland St Unit 1