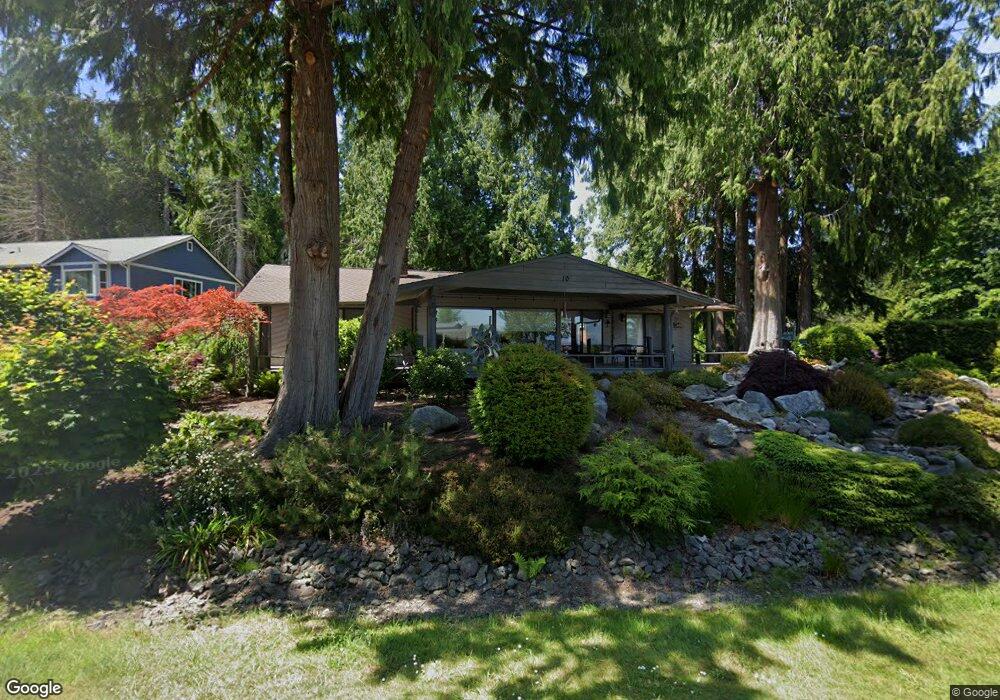
10 Trader Ln Port Ludlow, WA 98365
Port Ludlow NeighborhoodEstimated Value: $607,000 - $659,000
3
Beds
3
Baths
1,770
Sq Ft
$357/Sq Ft
Est. Value
About This Home
This home is located at 10 Trader Ln, Port Ludlow, WA 98365 and is currently estimated at $632,400, approximately $357 per square foot. 10 Trader Ln is a home located in Jefferson County with nearby schools including Chimacum Creek Primary School, Chimacum School Pi Program, and Chimacum Elementary School.
Ownership History
Date
Name
Owned For
Owner Type
Purchase Details
Closed on
Feb 18, 2016
Sold by
Susgar Properties Llc
Bought by
Painter Steven C and Painter Margaret S
Current Estimated Value
Home Financials for this Owner
Home Financials are based on the most recent Mortgage that was taken out on this home.
Original Mortgage
$200,000
Outstanding Balance
$155,715
Interest Rate
3.25%
Mortgage Type
Adjustable Rate Mortgage/ARM
Estimated Equity
$476,685
Purchase Details
Closed on
Oct 9, 2013
Sold by
Hackney Gary W and Garreston Susan E
Bought by
Susgar Properties Llc
Purchase Details
Closed on
Jul 20, 2006
Sold by
Clark William L and Clark Theodora L
Bought by
Hackney Gary W and Garretson Susan E
Home Financials for this Owner
Home Financials are based on the most recent Mortgage that was taken out on this home.
Original Mortgage
$340,000
Interest Rate
6.69%
Mortgage Type
New Conventional
Purchase Details
Closed on
Jun 23, 2005
Sold by
Wilson Pamela L
Bought by
Clark William L and Clark Theodora L
Home Financials for this Owner
Home Financials are based on the most recent Mortgage that was taken out on this home.
Original Mortgage
$340,400
Interest Rate
6.57%
Mortgage Type
Purchase Money Mortgage
Create a Home Valuation Report for This Property
The Home Valuation Report is an in-depth analysis detailing your home's value as well as a comparison with similar homes in the area
Home Values in the Area
Average Home Value in this Area
Purchase History
| Date | Buyer | Sale Price | Title Company |
|---|---|---|---|
| Painter Steven C | -- | None Available | |
| Susgar Properties Llc | -- | None Available | |
| Hackney Gary W | $425,000 | None Available | |
| Clark William L | $425,500 | First American Title |
Source: Public Records
Mortgage History
| Date | Status | Borrower | Loan Amount |
|---|---|---|---|
| Open | Painter Steven C | $200,000 | |
| Previous Owner | Hackney Gary W | $340,000 | |
| Previous Owner | Clark William L | $340,400 |
Source: Public Records
Tax History Compared to Growth
Tax History
| Year | Tax Paid | Tax Assessment Tax Assessment Total Assessment is a certain percentage of the fair market value that is determined by local assessors to be the total taxable value of land and additions on the property. | Land | Improvement |
|---|---|---|---|---|
| 2024 | $4,089 | $543,765 | $146,475 | $397,290 |
| 2023 | $4,089 | $515,236 | $134,500 | $380,736 |
| 2022 | $3,748 | $493,682 | $129,500 | $364,182 |
| 2021 | $3,688 | $408,032 | $111,800 | $296,232 |
| 2020 | $3,525 | $377,489 | $103,200 | $274,289 |
| 2019 | $3,349 | $346,946 | $94,600 | $252,346 |
| 2018 | $3,694 | $331,674 | $90,300 | $241,374 |
| 2017 | $3,502 | $323,926 | $86,000 | $237,926 |
| 2016 | $3,524 | $312,030 | $86,000 | $226,030 |
| 2015 | $3,505 | $309,967 | $118,393 | $191,574 |
| 2014 | -- | $309,967 | $118,393 | $191,574 |
| 2013 | -- | $269,535 | $102,950 | $166,585 |
Source: Public Records
Map
Nearby Homes
- 21 Camano Ln
- 80 Harms Ln
- 231 Resolute Ln
- 142 Resolute Ln
- 270 Pioneer Dr
- 37 Jackson Ln
- 61 Olympic Ln
- 111 Jackson Ln
- 155 Baldwin Ln
- 82 Montgomery Ln
- 72 Evans Ln
- 23 Machias Loop
- 270 Puget Loop
- 140 Condon Ln
- 104 Puget Loop
- 639 Rainier Ln
- 140 Admiralty Ln Unit 370
- 10 Olympic Place Unit 10
- Daniel Plan at Olympic Terrace
- Decker Plan at Olympic Terrace