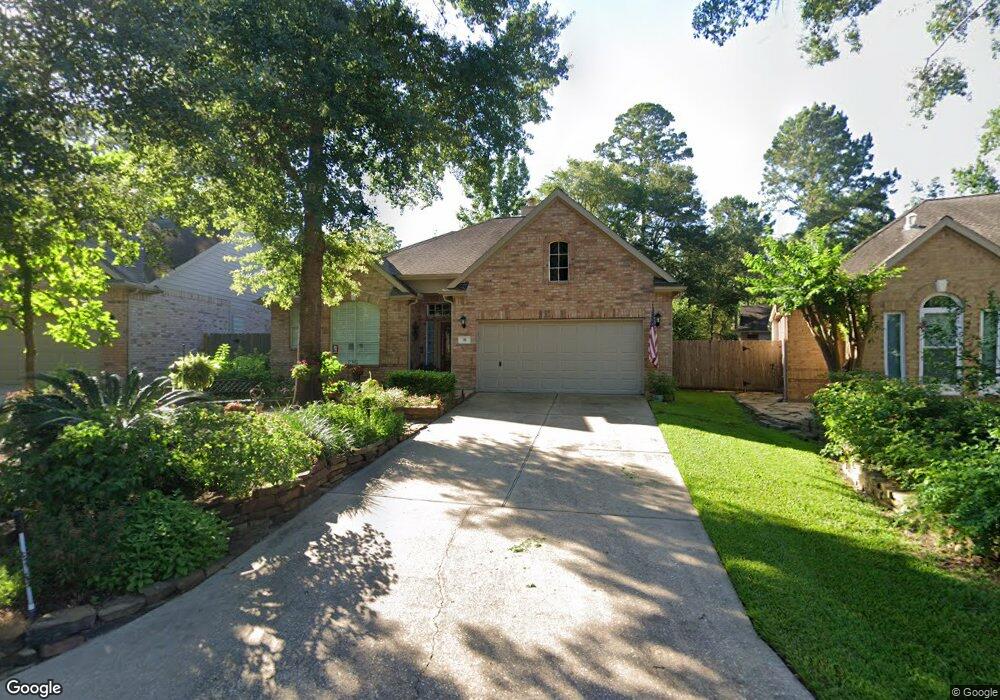
10 Tudor Glen Place Spring, TX 77382
Alden Bridge NeighborhoodEstimated Value: $403,511 - $428,000
--
Bed
2
Baths
1,939
Sq Ft
$213/Sq Ft
Est. Value
About This Home
This home is located at 10 Tudor Glen Place, Spring, TX 77382 and is currently estimated at $413,378, approximately $213 per square foot. 10 Tudor Glen Place is a home located in Montgomery County with nearby schools including Buckalew Elementary School, Mitchell Intermediate School, and McCullough Junior High School.
Ownership History
Date
Name
Owned For
Owner Type
Purchase Details
Closed on
Aug 30, 2007
Sold by
Shoales Fredrick A and Shoales Deborah A
Bought by
Santarsiere Giovanni and Santarsiere Lynee M
Current Estimated Value
Purchase Details
Closed on
Aug 8, 2002
Sold by
Greenwald Jean K
Bought by
Santarsiere Giovanni and Santarsiere Lynne
Home Financials for this Owner
Home Financials are based on the most recent Mortgage that was taken out on this home.
Original Mortgage
$100,000
Interest Rate
6.53%
Purchase Details
Closed on
Dec 4, 1998
Sold by
Lennar Homes Of Texas Inc
Bought by
Greenwald James R and Greenwald Jean K
Home Financials for this Owner
Home Financials are based on the most recent Mortgage that was taken out on this home.
Original Mortgage
$110,850
Interest Rate
6.81%
Mortgage Type
Stand Alone First
Purchase Details
Closed on
May 4, 1998
Sold by
Woodlands Land Development Lp
Bought by
Santarsiere Giovanni
Create a Home Valuation Report for This Property
The Home Valuation Report is an in-depth analysis detailing your home's value as well as a comparison with similar homes in the area
Home Values in the Area
Average Home Value in this Area
Purchase History
| Date | Buyer | Sale Price | Title Company |
|---|---|---|---|
| Santarsiere Giovanni | -- | Charter Title Company | |
| Santarsiere Giovanni | -- | First American Title | |
| Greenwald James R | -- | Regency Title | |
| Santarsiere Giovanni | -- | -- |
Source: Public Records
Mortgage History
| Date | Status | Borrower | Loan Amount |
|---|---|---|---|
| Previous Owner | Santarsiere Giovanni | $100,000 | |
| Previous Owner | Greenwald James R | $110,850 |
Source: Public Records
Tax History Compared to Growth
Tax History
| Year | Tax Paid | Tax Assessment Tax Assessment Total Assessment is a certain percentage of the fair market value that is determined by local assessors to be the total taxable value of land and additions on the property. | Land | Improvement |
|---|---|---|---|---|
| 2025 | $1,806 | $375,874 | -- | -- |
| 2024 | $1,794 | $341,704 | -- | -- |
| 2023 | $1,794 | $310,640 | $60,000 | $301,950 |
| 2022 | $5,724 | $282,400 | $60,000 | $286,680 |
| 2021 | $5,600 | $256,730 | $35,080 | $221,650 |
| 2020 | $6,634 | $286,810 | $35,080 | $251,730 |
| 2019 | $6,295 | $263,750 | $35,080 | $232,370 |
| 2018 | $4,458 | $239,770 | $35,080 | $204,690 |
| 2017 | $6,141 | $254,200 | $35,080 | $219,120 |
| 2016 | $5,623 | $232,730 | $35,080 | $206,050 |
| 2015 | $3,498 | $211,570 | $35,080 | $197,920 |
| 2014 | $3,498 | $192,340 | $35,080 | $165,920 |
Source: Public Records
Map
Nearby Homes
- 7 Coachman Ridge Place
- 27 S Belfair Place
- 39 E Honey Grove Place
- 22 E Sienna Place
- 230 S Walden Elms Cir
- 19 Timberstar St
- 35 N Walden Elms Cir
- 26 N Walden Elms Cir
- 71 N Acacia Park Cir
- 27 Auburn Path Dr
- 78 N Walden Elms Cir
- 18 Wintergreen Trail
- 2 Wintergreen Trail
- 269 Flaxen Chestnut
- 27 Medley Ln
- 47 Crocus Petal St
- 8051 Bay Branch Dr Unit 312
- 8051 Bay Branch Dr Unit 232
- 8051 Bay Branch Dr Unit 314
- 242 Flaxen Chestnut
- 14 Tudor Glen Place
- 6 Tudor Glen Place
- 18 Tudor Glen Place
- 91 W Ardsley Square Place
- 2 Tudor Glen Place
- 107 Ascot Way Ct
- 95 W Ardsley Square Place
- 15 Tudor Glen Place
- 87 W Ardsley Square Place
- 22 Tudor Glen Place
- 111 Ascot Way Ct
- 23 S Ashley Green
- 103 Ascot Way Ct
- 99 W Ardsley Square Place
- 19 Tudor Glen Place
- 26 Tudor Glen Place
- 23 Tudor Glen Place
- 15 S Ashley Green
- 115 Ascot Way Ct
- 7 Ashley Green