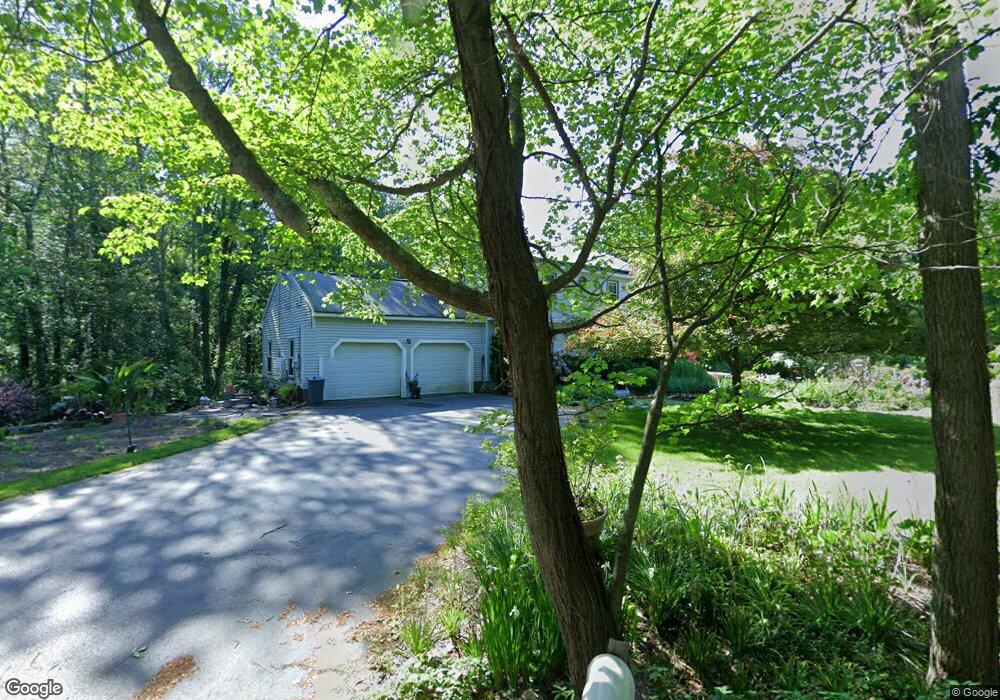
10 Union St Blackstone, MA 01504
Estimated Value: $484,000 - $659,000
3
Beds
2
Baths
1,700
Sq Ft
$330/Sq Ft
Est. Value
About This Home
This home is located at 10 Union St, Blackstone, MA 01504 and is currently estimated at $561,128, approximately $330 per square foot. 10 Union St is a home located in Worcester County with nearby schools including Blackstone-Millville Regional High School.
Ownership History
Date
Name
Owned For
Owner Type
Purchase Details
Closed on
Dec 29, 1993
Sold by
Blegstad Steven G and Blegstad Sara
Bought by
Kelley Brian A and Kelley Deborah
Current Estimated Value
Purchase Details
Closed on
Sep 11, 1990
Sold by
Union St T
Bought by
Blegstad Steven G
Create a Home Valuation Report for This Property
The Home Valuation Report is an in-depth analysis detailing your home's value as well as a comparison with similar homes in the area
Home Values in the Area
Average Home Value in this Area
Purchase History
| Date | Buyer | Sale Price | Title Company |
|---|---|---|---|
| Kelley Brian A | $145,900 | -- | |
| Blegstad Steven G | $146,900 | -- |
Source: Public Records
Mortgage History
| Date | Status | Borrower | Loan Amount |
|---|---|---|---|
| Open | Blegstad Steven G | $38,186 | |
| Closed | Blegstad Steven G | $43,230 | |
| Closed | Blegstad Steven G | $23,521 |
Source: Public Records
Tax History
| Year | Tax Paid | Tax Assessment Tax Assessment Total Assessment is a certain percentage of the fair market value that is determined by local assessors to be the total taxable value of land and additions on the property. | Land | Improvement |
|---|---|---|---|---|
| 2025 | $6,159 | $407,900 | $175,000 | $232,900 |
| 2024 | $6,158 | $377,100 | $183,500 | $193,600 |
| 2023 | $5,736 | $354,500 | $183,500 | $171,000 |
| 2022 | $5,758 | $321,700 | $164,100 | $157,600 |
| 2021 | $12,985 | $308,300 | $164,100 | $144,200 |
| 2020 | $5,896 | $312,600 | $164,400 | $148,200 |
| 2019 | $11,698 | $304,700 | $155,100 | $149,600 |
| 2018 | $5,681 | $287,500 | $151,900 | $135,600 |
| 2017 | $5,466 | $283,800 | $157,200 | $126,600 |
| 2016 | $5,102 | $263,800 | $131,500 | $132,300 |
| 2015 | $4,926 | $252,900 | $124,300 | $128,600 |
Source: Public Records
Map
Nearby Homes
- 27 Liberty Hill Dr
- 220 Millville Rd
- 1, 3, 5 Old Lincoln St
- 179 Thayer St
- 81 Thayer St
- 162 Blackstone St
- 57 Kempton Rd
- 185 Elm St
- 183 Elm St Unit 185
- 284 Lincoln St
- 53 Asylum St
- 183 Blackstone St
- 13 Dawes St
- 13A Asylum St
- 18 Chestnut Hill Rd
- 0 Main St
- 111 Providence St
- Lot 3 Pickering Rd
- Lot 2 Pickering Rd
- Lot 1 Pickering Rd
Your Personal Tour Guide
Ask me questions while you tour the home.