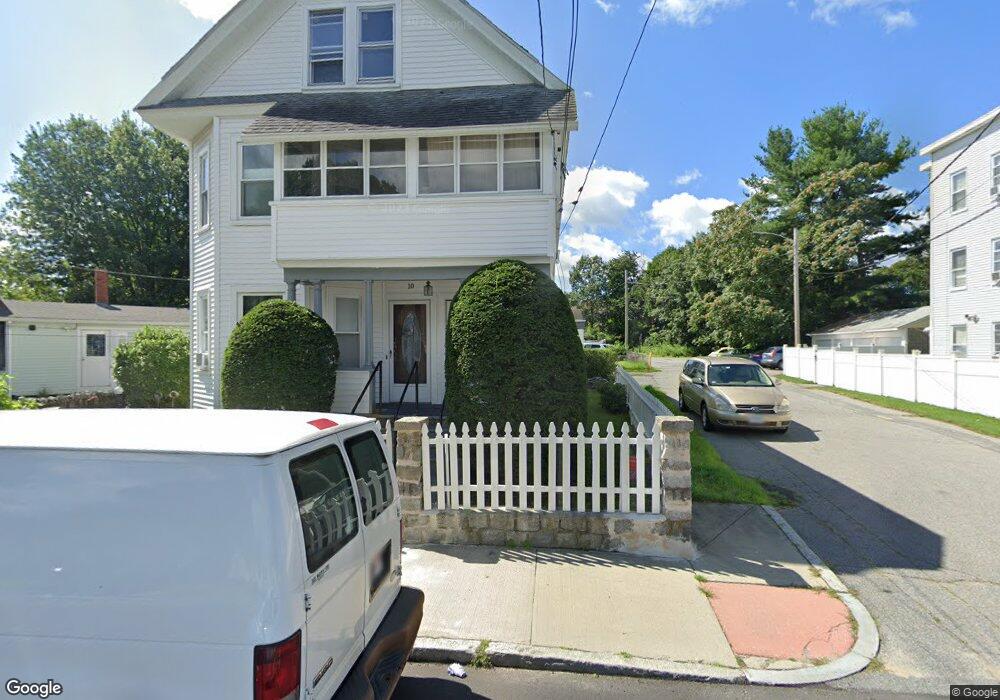
10 Union St Unit 12 Methuen, MA 01844
Downtown Methuen NeighborhoodEstimated Value: $628,000 - $708,547
4
Beds
2
Baths
2,346
Sq Ft
$285/Sq Ft
Est. Value
About This Home
This home is located at 10 Union St Unit 12, Methuen, MA 01844 and is currently estimated at $669,137, approximately $285 per square foot. 10 Union St Unit 12 is a home located in Essex County with nearby schools including Marsh Grammar School, South Point Elementary School, and Methuen High School.
Ownership History
Date
Name
Owned For
Owner Type
Purchase Details
Closed on
Jun 14, 2013
Sold by
Mccarthy Catherine C
Bought by
10-12 Union Street Irt and Alejandro
Current Estimated Value
Purchase Details
Closed on
Aug 15, 2008
Sold by
Mccarthy Catherine C and Mccarthy Alejandro Jenny
Bought by
Mccarthy Catherine C
Purchase Details
Closed on
Apr 2, 2008
Sold by
Mccarthy Catherine C
Bought by
Mccarthy Catherine C and Mccarthy Alejandro Jenny
Create a Home Valuation Report for This Property
The Home Valuation Report is an in-depth analysis detailing your home's value as well as a comparison with similar homes in the area
Home Values in the Area
Average Home Value in this Area
Purchase History
| Date | Buyer | Sale Price | Title Company |
|---|---|---|---|
| 10-12 Union Street Irt | -- | -- | |
| 10-12 Union Street Irt | -- | -- | |
| Mccarthy Catherine C | -- | -- | |
| Mccarthy Catherine C | -- | -- | |
| Mccarthy Catherine C | -- | -- | |
| Mccarthy Catherine C | -- | -- |
Source: Public Records
Tax History Compared to Growth
Tax History
| Year | Tax Paid | Tax Assessment Tax Assessment Total Assessment is a certain percentage of the fair market value that is determined by local assessors to be the total taxable value of land and additions on the property. | Land | Improvement |
|---|---|---|---|---|
| 2025 | $6,902 | $652,400 | $182,900 | $469,500 |
| 2024 | $6,226 | $573,300 | $159,900 | $413,400 |
| 2023 | $6,073 | $519,100 | $140,700 | $378,400 |
| 2022 | $5,498 | $421,300 | $115,100 | $306,200 |
| 2021 | $5,261 | $398,900 | $108,700 | $290,200 |
| 2020 | $5,037 | $374,800 | $108,700 | $266,100 |
| 2019 | $4,512 | $318,000 | $94,900 | $223,100 |
| 2018 | $4,180 | $292,900 | $88,900 | $204,000 |
| 2017 | $4,017 | $274,200 | $83,000 | $191,200 |
| 2016 | $3,665 | $247,500 | $77,100 | $170,400 |
| 2015 | $3,495 | $239,400 | $77,100 | $162,300 |
Source: Public Records
Map
Nearby Homes