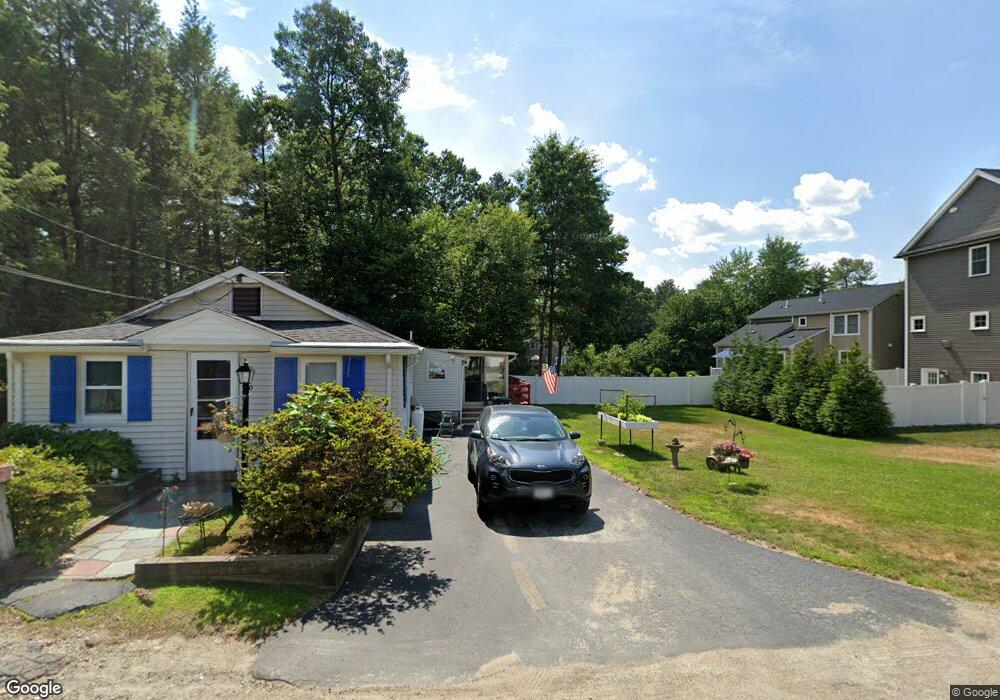
10 Upland Rd Natick, MA 01760
Estimated Value: $583,000 - $875,000
4
Beds
2
Baths
1,160
Sq Ft
$601/Sq Ft
Est. Value
About This Home
This home is located at 10 Upland Rd, Natick, MA 01760 and is currently estimated at $697,689, approximately $601 per square foot. 10 Upland Rd is a home located in Middlesex County with nearby schools including Natick High School, Wilson Middle School, and Bennett-Hemenway (Ben-Hem) Elementary School.
Ownership History
Date
Name
Owned For
Owner Type
Purchase Details
Closed on
Jun 18, 2010
Sold by
Collari John L and Collari Ruth M
Bought by
Collari John L and Collari Ruth M
Current Estimated Value
Purchase Details
Closed on
May 31, 1962
Bought by
John L & Ruth M Collari Irt
Create a Home Valuation Report for This Property
The Home Valuation Report is an in-depth analysis detailing your home's value as well as a comparison with similar homes in the area
Home Values in the Area
Average Home Value in this Area
Purchase History
| Date | Buyer | Sale Price | Title Company |
|---|---|---|---|
| Collari John L | -- | -- | |
| John L Collari Irt | -- | -- | |
| John L Collari Irt | -- | -- | |
| Collari John L | -- | -- | |
| Collari John L | -- | -- | |
| John L & Ruth M Collari Irt | -- | -- |
Source: Public Records
Mortgage History
| Date | Status | Borrower | Loan Amount |
|---|---|---|---|
| Previous Owner | John L & Ruth M Collari Irt | $61,000 | |
| Previous Owner | John L & Ruth M Collari Irt | $10,000 |
Source: Public Records
Tax History Compared to Growth
Tax History
| Year | Tax Paid | Tax Assessment Tax Assessment Total Assessment is a certain percentage of the fair market value that is determined by local assessors to be the total taxable value of land and additions on the property. | Land | Improvement |
|---|---|---|---|---|
| 2025 | $5,046 | $421,900 | $395,200 | $26,700 |
| 2024 | $4,870 | $397,200 | $372,000 | $25,200 |
| 2023 | $4,832 | $382,300 | $358,000 | $24,300 |
| 2022 | $4,638 | $347,700 | $325,500 | $22,200 |
| 2021 | $9,036 | $337,800 | $306,900 | $30,900 |
| 2020 | $5,301 | $334,100 | $292,900 | $41,200 |
| 2019 | $8,692 | $334,100 | $292,900 | $41,200 |
| 2018 | $4,260 | $326,400 | $279,000 | $47,400 |
| 2017 | $4,251 | $284,500 | $237,100 | $47,400 |
| 2016 | $3,500 | $257,900 | $211,100 | $46,800 |
| 2015 | $3,514 | $254,300 | $211,100 | $43,200 |
Source: Public Records
Map
Nearby Homes