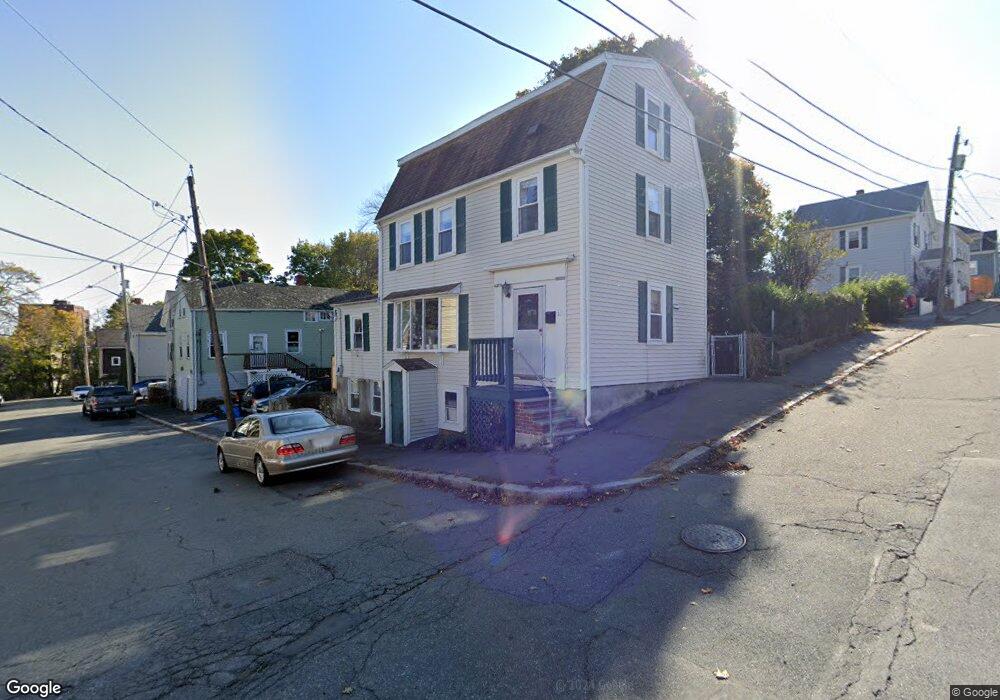
10 Varney St Salem, MA 01970
Gallows Hill NeighborhoodEstimated Value: $507,000 - $596,000
2
Beds
2
Baths
1,150
Sq Ft
$474/Sq Ft
Est. Value
About This Home
This home is located at 10 Varney St, Salem, MA 01970 and is currently estimated at $545,460, approximately $474 per square foot. 10 Varney St is a home located in Essex County with nearby schools including Witchcraft Heights Elementary School, Horace Mann Laboratory, and Bates Elementary School.
Ownership History
Date
Name
Owned For
Owner Type
Purchase Details
Closed on
Oct 20, 2011
Sold by
Styczko Paul
Bought by
Sheehan Jennifer L
Current Estimated Value
Home Financials for this Owner
Home Financials are based on the most recent Mortgage that was taken out on this home.
Original Mortgage
$209,451
Outstanding Balance
$143,198
Interest Rate
4.15%
Mortgage Type
Purchase Money Mortgage
Estimated Equity
$402,262
Purchase Details
Closed on
Nov 15, 1990
Sold by
Murphy Timothy L
Bought by
Styczko Paul
Purchase Details
Closed on
Apr 29, 1987
Sold by
Macdonald Edward E
Bought by
Murphy Timothy L
Create a Home Valuation Report for This Property
The Home Valuation Report is an in-depth analysis detailing your home's value as well as a comparison with similar homes in the area
Home Values in the Area
Average Home Value in this Area
Purchase History
| Date | Buyer | Sale Price | Title Company |
|---|---|---|---|
| Sheehan Jennifer L | $214,900 | -- | |
| Styczko Paul | $109,000 | -- | |
| Murphy Timothy L | $120,000 | -- |
Source: Public Records
Mortgage History
| Date | Status | Borrower | Loan Amount |
|---|---|---|---|
| Open | Murphy Timothy L | $209,451 | |
| Previous Owner | Murphy Timothy L | $75,000 | |
| Previous Owner | Murphy Timothy L | $40,000 |
Source: Public Records
Tax History
| Year | Tax Paid | Tax Assessment Tax Assessment Total Assessment is a certain percentage of the fair market value that is determined by local assessors to be the total taxable value of land and additions on the property. | Land | Improvement |
|---|---|---|---|---|
| 2025 | $5,375 | $474,000 | $170,400 | $303,600 |
| 2024 | $5,195 | $447,100 | $161,400 | $285,700 |
| 2023 | $5,025 | $401,700 | $149,500 | $252,200 |
| 2022 | $4,778 | $360,600 | $140,500 | $220,100 |
| 2021 | $4,836 | $350,400 | $140,500 | $209,900 |
| 2020 | $4,436 | $307,000 | $121,400 | $185,600 |
| 2019 | $4,412 | $292,200 | $115,400 | $176,800 |
| 2018 | $4,277 | $278,100 | $110,000 | $168,100 |
| 2017 | $3,930 | $247,800 | $89,700 | $158,100 |
| 2016 | $3,808 | $243,000 | $84,900 | $158,100 |
| 2015 | $3,689 | $224,800 | $76,500 | $148,300 |
Source: Public Records
Map
Nearby Homes
- 12 Varney St
- 23 Proctor St
- 128 Boston St Unit 4
- 15 Wall St
- 107 Mason St
- 111 Mason St
- 145 Boston St
- 55 Summit St
- 68 Beaver St
- 82 Flint St
- 86 Flint St
- 35 Flint St Unit 209
- 35 Flint St Unit 106
- 18 Dalton Pkwy Unit 18
- 145 Federal St Unit 3
- 20 Beacon St
- 4 Valley St
- 23 River St
- 16 River St
- 15 Phelps St Unit 1
Your Personal Tour Guide
Ask me questions while you tour the home.