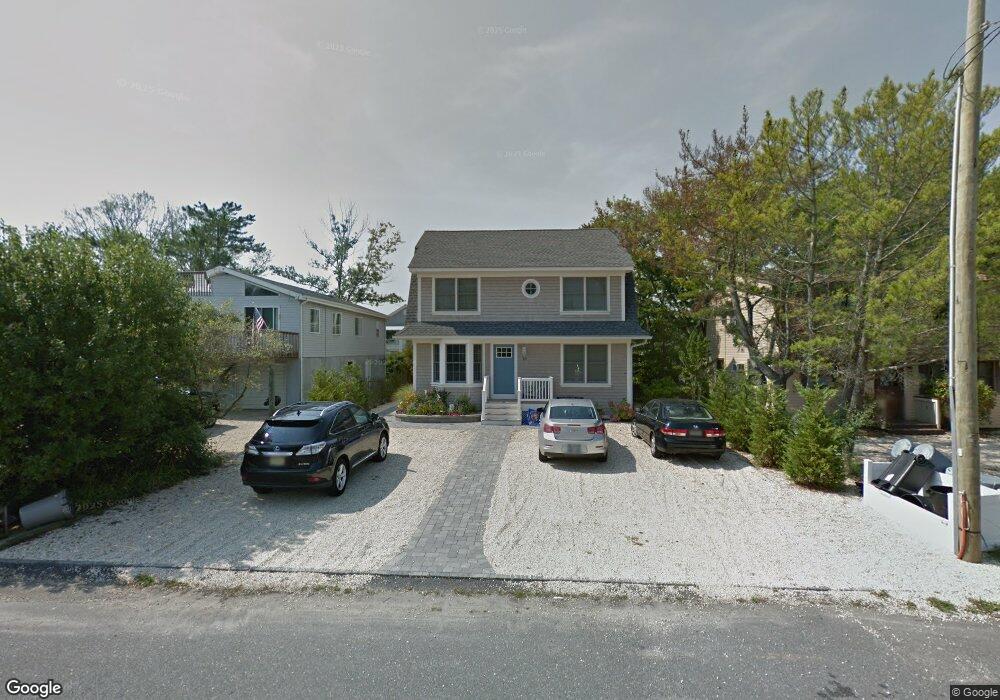
10 W 22nd St Barnegat Light, NJ 08006
Long Beach Island NeighborhoodEstimated Value: $1,662,000 - $1,923,000
4
Beds
3
Baths
2,044
Sq Ft
$892/Sq Ft
Est. Value
About This Home
This home is located at 10 W 22nd St, Barnegat Light, NJ 08006 and is currently estimated at $1,823,480, approximately $892 per square foot. 10 W 22nd St is a home with nearby schools including Ethel A. Jacobsen Elementary School, Long Beach Island Grade School, and Southern Regional Middle School.
Ownership History
Date
Name
Owned For
Owner Type
Purchase Details
Closed on
Oct 19, 2018
Sold by
Reenstra Andrew and Reenstra Courtney
Bought by
Kaprelian Michael C and Kaprelian Viviana A
Current Estimated Value
Home Financials for this Owner
Home Financials are based on the most recent Mortgage that was taken out on this home.
Original Mortgage
$770,000
Outstanding Balance
$672,915
Interest Rate
4.6%
Mortgage Type
New Conventional
Estimated Equity
$1,150,565
Purchase Details
Closed on
Dec 30, 2010
Sold by
Mckenna Anne M and Bunyan Helen
Bought by
Reenstra Andrew and Reenstra Courtney
Create a Home Valuation Report for This Property
The Home Valuation Report is an in-depth analysis detailing your home's value as well as a comparison with similar homes in the area
Home Values in the Area
Average Home Value in this Area
Purchase History
| Date | Buyer | Sale Price | Title Company |
|---|---|---|---|
| Kaprelian Michael C | $962,500 | Southern Shores Title Agency | |
| Reenstra Andrew | $410,000 | First American Title Ins Co |
Source: Public Records
Mortgage History
| Date | Status | Borrower | Loan Amount |
|---|---|---|---|
| Open | Kaprelian Michael C | $770,000 |
Source: Public Records
Tax History Compared to Growth
Tax History
| Year | Tax Paid | Tax Assessment Tax Assessment Total Assessment is a certain percentage of the fair market value that is determined by local assessors to be the total taxable value of land and additions on the property. | Land | Improvement |
|---|---|---|---|---|
| 2025 | $9,455 | $938,000 | $375,000 | $563,000 |
| 2024 | $8,358 | $938,000 | $375,000 | $563,000 |
| 2023 | $7,757 | $938,000 | $375,000 | $563,000 |
| 2022 | $7,757 | $938,000 | $375,000 | $563,000 |
| 2021 | $8,348 | $938,000 | $375,000 | $563,000 |
| 2020 | $8,470 | $938,000 | $375,000 | $563,000 |
| 2019 | $8,161 | $938,000 | $375,000 | $563,000 |
| 2018 | $6,558 | $767,000 | $375,000 | $392,000 |
| 2017 | $6,788 | $767,000 | $375,000 | $392,000 |
| 2016 | $6,612 | $767,000 | $375,000 | $392,000 |
| 2015 | $6,374 | $767,000 | $375,000 | $392,000 |
| 2014 | $6,941 | $767,800 | $375,000 | $392,800 |
Source: Public Records
Map
Nearby Homes