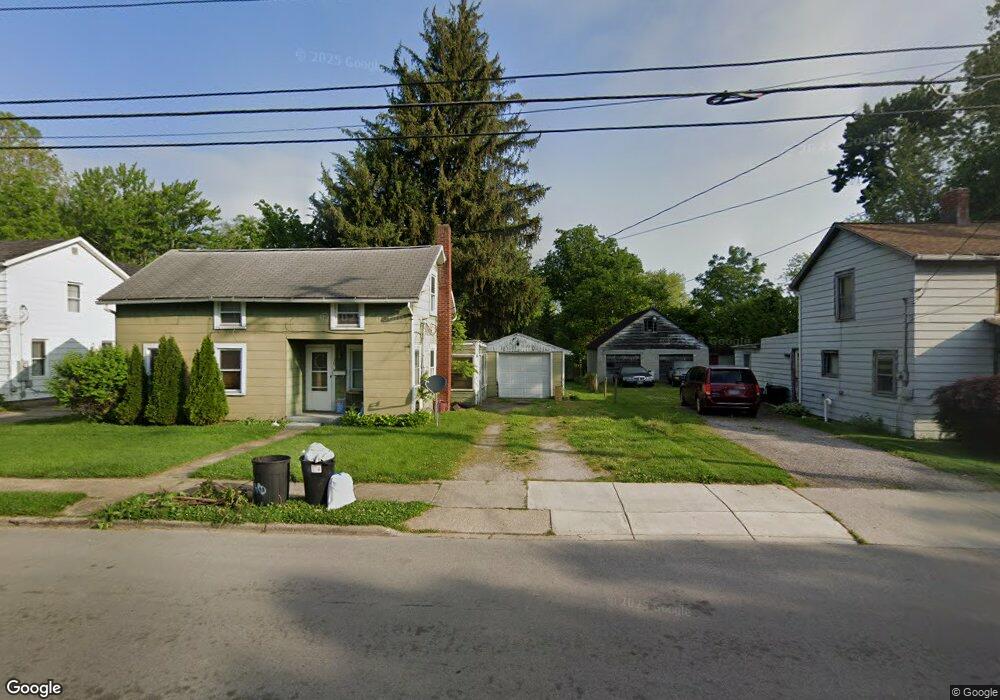
10 W Elm St Norwalk, OH 44857
Estimated Value: $133,351 - $147,000
2
Beds
1
Bath
1,166
Sq Ft
$120/Sq Ft
Est. Value
About This Home
This home is located at 10 W Elm St, Norwalk, OH 44857 and is currently estimated at $139,588, approximately $119 per square foot. 10 W Elm St is a home located in Huron County with nearby schools including Maplehurst Elementary School, Pleasant Elementary School, and League Elementary School.
Ownership History
Date
Name
Owned For
Owner Type
Purchase Details
Closed on
Dec 28, 2004
Bought by
Tyne Enterprises Llc
Current Estimated Value
Purchase Details
Closed on
Dec 27, 2002
Sold by
Federal National Mortgage Association
Bought by
Myers Michael J
Purchase Details
Closed on
May 7, 2002
Sold by
Bistline Rosemary
Bought by
Federal National Mortgage Association
Purchase Details
Closed on
Apr 30, 1999
Sold by
Vandresser Frank W
Bought by
Bistline Rosemary
Home Financials for this Owner
Home Financials are based on the most recent Mortgage that was taken out on this home.
Original Mortgage
$54,000
Interest Rate
7.05%
Mortgage Type
New Conventional
Purchase Details
Closed on
Jan 14, 1983
Bought by
Vandresser Frank W
Create a Home Valuation Report for This Property
The Home Valuation Report is an in-depth analysis detailing your home's value as well as a comparison with similar homes in the area
Home Values in the Area
Average Home Value in this Area
Purchase History
| Date | Buyer | Sale Price | Title Company |
|---|---|---|---|
| Tyne Enterprises Llc | -- | -- | |
| Myers Michael J | $42,500 | -- | |
| Federal National Mortgage Association | $36,667 | -- | |
| Bistline Rosemary | $55,700 | -- | |
| Vandresser Frank W | -- | -- |
Source: Public Records
Mortgage History
| Date | Status | Borrower | Loan Amount |
|---|---|---|---|
| Previous Owner | Bistline Rosemary | $54,000 |
Source: Public Records
Tax History Compared to Growth
Tax History
| Year | Tax Paid | Tax Assessment Tax Assessment Total Assessment is a certain percentage of the fair market value that is determined by local assessors to be the total taxable value of land and additions on the property. | Land | Improvement |
|---|---|---|---|---|
| 2024 | $1,365 | $32,830 | $7,640 | $25,190 |
| 2023 | $1,365 | $27,460 | $6,140 | $21,320 |
| 2022 | $1,130 | $27,460 | $6,140 | $21,320 |
| 2021 | $1,131 | $27,460 | $6,140 | $21,320 |
| 2020 | $1,002 | $23,150 | $5,100 | $18,050 |
| 2019 | $981 | $23,150 | $5,100 | $18,050 |
| 2018 | $964 | $23,150 | $5,100 | $18,050 |
| 2017 | $769 | $18,380 | $5,270 | $13,110 |
| 2016 | $755 | $18,380 | $5,270 | $13,110 |
| 2015 | $755 | $18,400 | $5,280 | $13,120 |
| 2014 | $744 | $17,960 | $5,290 | $12,670 |
| 2013 | $649 | $17,960 | $5,290 | $12,670 |
Source: Public Records
Map
Nearby Homes