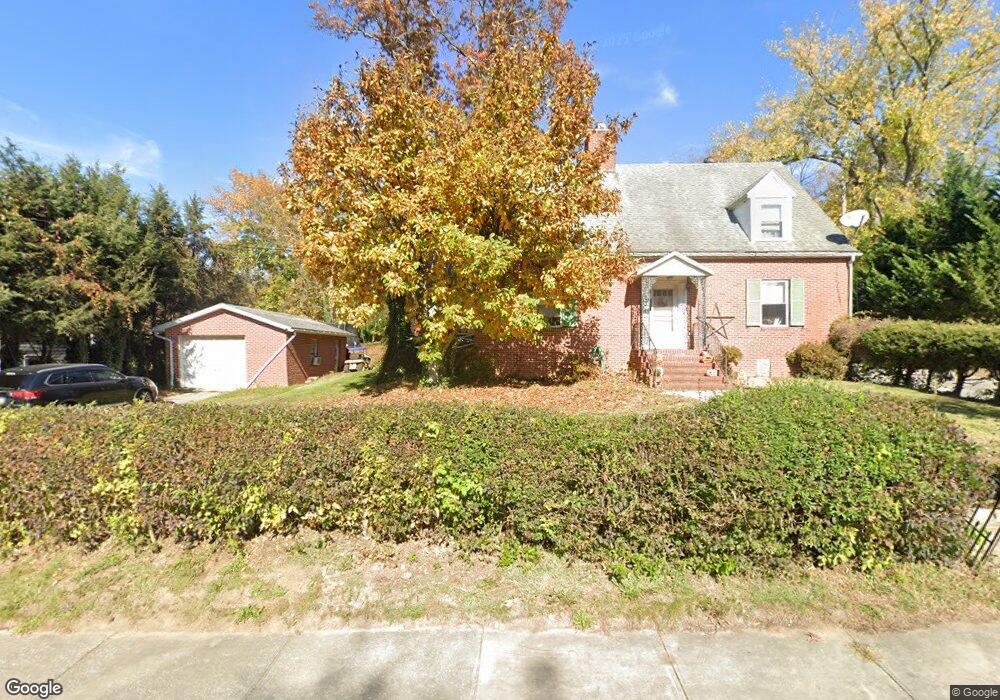
10 W High St Hancock, MD 21750
Estimated Value: $223,000 - $298,000
Studio
1
Bath
1,740
Sq Ft
$141/Sq Ft
Est. Value
About This Home
This home is located at 10 W High St, Hancock, MD 21750 and is currently estimated at $245,809, approximately $141 per square foot. 10 W High St is a home located in Washington County with nearby schools including Hancock Elementary School and Hancock Middle Senior High School.
Ownership History
Date
Name
Owned For
Owner Type
Purchase Details
Closed on
May 3, 2023
Sold by
Mellott Brandon Mccellan
Bought by
Mellott Sheena and Mellott Brandon Mccellan
Current Estimated Value
Home Financials for this Owner
Home Financials are based on the most recent Mortgage that was taken out on this home.
Original Mortgage
$146,438
Outstanding Balance
$142,314
Interest Rate
6.32%
Mortgage Type
FHA
Estimated Equity
$103,495
Purchase Details
Closed on
May 3, 2013
Sold by
Cubbage Shirley Jean
Bought by
Mellott Brandon Mccellan
Purchase Details
Closed on
May 16, 2008
Sold by
Mills Darwin T and Mills June D
Bought by
Poteet Evelyn F C
Purchase Details
Closed on
Oct 2, 2001
Sold by
Poteet Evelyn F
Bought by
Mills Darwin T and Mills June D
Create a Home Valuation Report for This Property
The Home Valuation Report is an in-depth analysis detailing your home's value as well as a comparison with similar homes in the area
Purchase History
| Date | Buyer | Sale Price | Title Company |
|---|---|---|---|
| Mellott Sheena | -- | None Listed On Document | |
| Mellott Sheena | -- | None Listed On Document | |
| Mellott Brandon Mccellan | -- | None Available | |
| Cubbage Shirley Jean | -- | None Available | |
| Poteet Evelyn F C | $138,000 | -- | |
| Poteet Evelyn F C | $138,000 | -- | |
| Mills Darwin T | $75,000 | -- |
Source: Public Records
Mortgage History
| Date | Status | Borrower | Loan Amount |
|---|---|---|---|
| Open | Mellott Sheena | $146,438 | |
| Closed | Mellott Sheena | $146,438 |
Source: Public Records
Tax History
| Year | Tax Paid | Tax Assessment Tax Assessment Total Assessment is a certain percentage of the fair market value that is determined by local assessors to be the total taxable value of land and additions on the property. | Land | Improvement |
|---|---|---|---|---|
| 2025 | $1,299 | $179,933 | $0 | $0 |
| 2024 | $1,299 | $157,467 | $0 | $0 |
| 2023 | $1,230 | $135,000 | $28,800 | $106,200 |
| 2022 | $1,201 | $131,867 | $0 | $0 |
| 2021 | $1,169 | $128,733 | $0 | $0 |
| 2020 | $1,169 | $125,600 | $31,300 | $94,300 |
| 2019 | $1,174 | $125,600 | $31,300 | $94,300 |
| 2018 | $1,174 | $125,600 | $31,300 | $94,300 |
| 2017 | $1,194 | $127,700 | $0 | $0 |
| 2016 | -- | $127,700 | $0 | $0 |
| 2015 | $1,576 | $127,700 | $0 | $0 |
| 2014 | $1,576 | $133,700 | $0 | $0 |
Source: Public Records
Map
Nearby Homes
- 104 W High St
- 0 S Pennsylvania Ave
- Lot 28 S Pennsylvania Ave
- 103 Franklin St
- 102 E Main St
- 214 Jackson St
- 216 Maryland Ave
- 28 Brent St
- 19 Brent St
- 212 Terrace St
- 200 E Main St
- 3659 Fairview Dr
- 286 Timber Ridge Rd
- 0 Forever View Ln Unit WVMO2007308
- 55 Morosko Ln
- 14507 Heavenly Acres Ridge
- 170 Horseshoe Dr
- 0 Fairview Oaks Way Unit WVMO2006328
- 0 Black Oak Rd
- 4014 Resley Rd
Your Personal Tour Guide
Ask me questions while you tour the home.