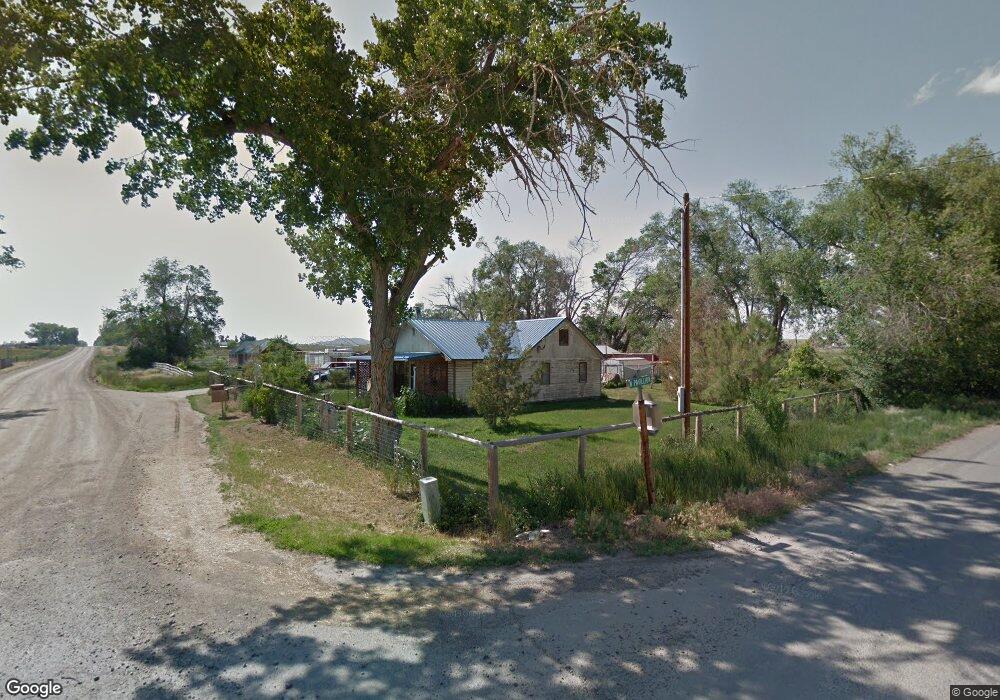
10 W Pavillion Rd Pavillion, WY 82523
Estimated Value: $241,000 - $252,311
2
Beds
1
Bath
936
Sq Ft
$264/Sq Ft
Est. Value
About This Home
This home is located at 10 W Pavillion Rd, Pavillion, WY 82523 and is currently estimated at $246,656, approximately $263 per square foot. 10 W Pavillion Rd is a home with nearby schools including Wind River High School.
Ownership History
Date
Name
Owned For
Owner Type
Purchase Details
Closed on
May 5, 2023
Sold by
Enslin Armand and Enslin Nicole
Bought by
Carruthers Patrick W and Donoghue Collins P
Current Estimated Value
Home Financials for this Owner
Home Financials are based on the most recent Mortgage that was taken out on this home.
Original Mortgage
$213,750
Outstanding Balance
$207,839
Interest Rate
6.42%
Mortgage Type
New Conventional
Estimated Equity
$38,817
Purchase Details
Closed on
Sep 28, 2021
Sold by
Ophus Calvin and Ophus Calli
Bought by
Enslin Armand and Enslin Nicole
Home Financials for this Owner
Home Financials are based on the most recent Mortgage that was taken out on this home.
Original Mortgage
$130,000
Interest Rate
2.8%
Mortgage Type
New Conventional
Purchase Details
Closed on
Oct 7, 2019
Sold by
Krone Lawrence H and Krone Randee R
Bought by
Ophus Calvin and Ophus Calli
Home Financials for this Owner
Home Financials are based on the most recent Mortgage that was taken out on this home.
Original Mortgage
$123,500
Interest Rate
3.5%
Mortgage Type
New Conventional
Create a Home Valuation Report for This Property
The Home Valuation Report is an in-depth analysis detailing your home's value as well as a comparison with similar homes in the area
Home Values in the Area
Average Home Value in this Area
Purchase History
| Date | Buyer | Sale Price | Title Company |
|---|---|---|---|
| Carruthers Patrick W | -- | None Listed On Document | |
| Enslin Armand | -- | None Listed On Document | |
| Ophus Calvin | -- | None Available |
Source: Public Records
Mortgage History
| Date | Status | Borrower | Loan Amount |
|---|---|---|---|
| Open | Carruthers Patrick W | $213,750 | |
| Previous Owner | Enslin Armand | $130,000 | |
| Previous Owner | Ophus Calvin | $123,500 |
Source: Public Records
Tax History Compared to Growth
Tax History
| Year | Tax Paid | Tax Assessment Tax Assessment Total Assessment is a certain percentage of the fair market value that is determined by local assessors to be the total taxable value of land and additions on the property. | Land | Improvement |
|---|---|---|---|---|
| 2025 | $1,420 | $14,866 | $5,478 | $9,388 |
| 2024 | $1,420 | $19,444 | $7,304 | $12,140 |
| 2023 | $1,369 | $18,362 | $7,304 | $11,058 |
| 2022 | $1,133 | $15,544 | $6,342 | $9,202 |
| 2021 | $1,050 | $13,970 | $5,124 | $8,846 |
| 2020 | $841 | $11,225 | $5,124 | $6,101 |
| 2019 | $819 | $11,202 | $5,124 | $6,078 |
| 2018 | $790 | $10,827 | $5,124 | $5,703 |
| 2017 | $1,300 | $10,751 | $5,124 | $5,627 |
| 2016 | $1,269 | $10,445 | $5,011 | $5,434 |
| 2015 | $759 | $10,596 | $5,011 | $5,585 |
| 2014 | $767 | $10,585 | $5,011 | $5,574 |
Source: Public Records
Map
Nearby Homes
- 203 N Main St
- 0 Unit 11532534
- No Situs Unit Pavillion WY 82523
- 785 W Pavillion Rd
- 396 Wyoming 133
- 000 Shetland Rd
- 66 Shady Ln
- 0 Tunnel Hill Rd
- 11693 U S 26
- 99 Ocean Lake Rd
- 3402 W Main
- Lot 3 Petersdorf
- Lot 2 Petersdorf
- 00 N 1st
- 2045 Riverview
- 2015 Riverview
- 1955 Riverview
- 25 Owl View Rd
- 10322 Hwy 26
- 10332 Highway 26 Unit LotWP001
- 13 W Pavillion Rd Unit HWY 133
- 380 W Center Ave
- 275 Wyoming 133
- 389 Wyoming 133
- 212 W Center Ave
- 202 W Center Ave Unit N Pine
- 330 W Center Ave
- 106 S Pine St
- 102 N Pine St
- 20 W Pavillion Rd
- 122 N Pine St
- 112 N Pine St
- 116 S Pine St Unit Dallas
- 204 N Pine St
- 210 N Pine St
- 202 S Pine St
- 115 S Pine St
- 107 S Pine St
- 111 S Pine St
- 218 S Pine St