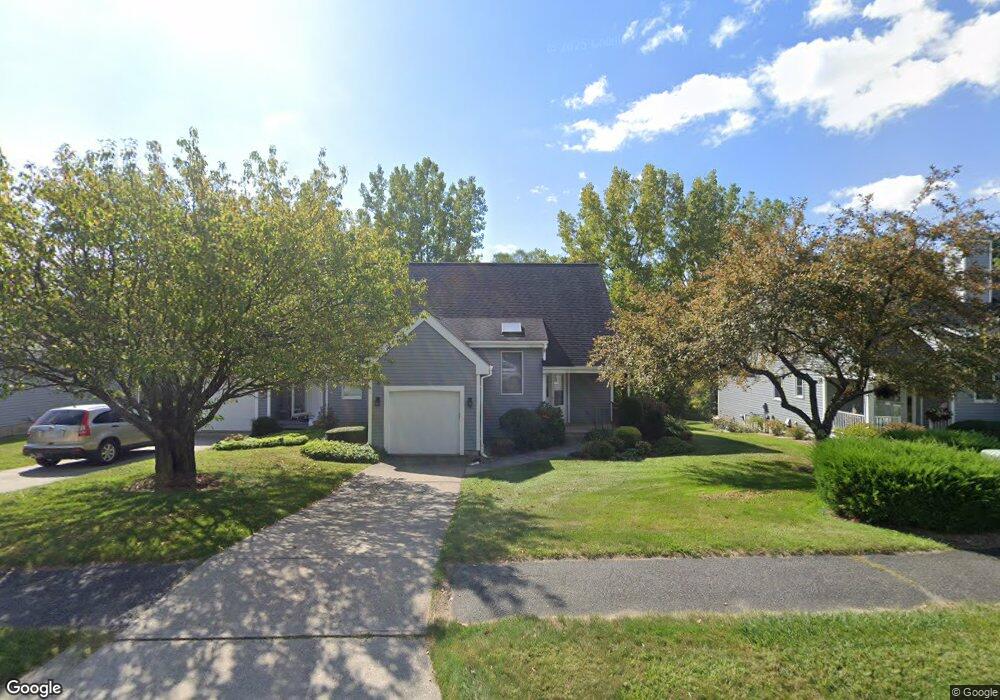
10 Walden Ln Pittsfield, MA 01201
Estimated Value: $383,718 - $512,000
3
Beds
3
Baths
1,512
Sq Ft
$310/Sq Ft
Est. Value
About This Home
This home is located at 10 Walden Ln, Pittsfield, MA 01201 and is currently estimated at $468,930, approximately $310 per square foot. 10 Walden Ln is a home located in Berkshire County with nearby schools including Robert T. Capeless Elementary School, John T. Reid Middle School, and Taconic High School.
Ownership History
Date
Name
Owned For
Owner Type
Purchase Details
Closed on
Jul 22, 2019
Sold by
Serber Adele
Bought by
Serber Adele and Serber Richard S
Current Estimated Value
Purchase Details
Closed on
Jun 27, 2003
Sold by
Rosen Ft and Rosen Bernice M
Bought by
Serber Adele and Serber Michael
Home Financials for this Owner
Home Financials are based on the most recent Mortgage that was taken out on this home.
Original Mortgage
$128,000
Interest Rate
5.53%
Mortgage Type
Purchase Money Mortgage
Purchase Details
Closed on
Oct 15, 1998
Sold by
Sonnys Place T and Needle Marcia
Bought by
Rosen Ft and Rosen Seymour L
Home Financials for this Owner
Home Financials are based on the most recent Mortgage that was taken out on this home.
Original Mortgage
$60,000
Interest Rate
6.8%
Mortgage Type
Purchase Money Mortgage
Purchase Details
Closed on
Jun 16, 1988
Sold by
T E Wall Dev Corp
Bought by
Sonnys Place Tr
Create a Home Valuation Report for This Property
The Home Valuation Report is an in-depth analysis detailing your home's value as well as a comparison with similar homes in the area
Home Values in the Area
Average Home Value in this Area
Purchase History
| Date | Buyer | Sale Price | Title Company |
|---|---|---|---|
| Serber Adele | -- | -- | |
| Serber Adele | $178,000 | -- | |
| Rosen Ft | $140,000 | -- | |
| Sonnys Place Tr | $145,820 | -- |
Source: Public Records
Mortgage History
| Date | Status | Borrower | Loan Amount |
|---|---|---|---|
| Previous Owner | Serber Adele | $128,000 | |
| Previous Owner | Sonnys Place Tr | $60,000 |
Source: Public Records
Tax History
| Year | Tax Paid | Tax Assessment Tax Assessment Total Assessment is a certain percentage of the fair market value that is determined by local assessors to be the total taxable value of land and additions on the property. | Land | Improvement |
|---|---|---|---|---|
| 2025 | $7,517 | $419,000 | $60,100 | $358,900 |
| 2024 | $6,743 | $365,500 | $60,100 | $305,400 |
| 2023 | $6,108 | $333,400 | $55,500 | $277,900 |
| 2022 | $5,310 | $286,100 | $44,400 | $241,700 |
| 2021 | $5,411 | $281,100 | $44,400 | $236,700 |
| 2020 | $5,552 | $281,700 | $44,400 | $237,300 |
| 2019 | $5,156 | $265,500 | $44,400 | $221,100 |
| 2018 | $5,199 | $259,800 | $44,400 | $215,400 |
| 2017 | $4,886 | $248,900 | $41,600 | $207,300 |
| 2016 | $4,786 | $255,100 | $41,600 | $213,500 |
| 2015 | $4,607 | $255,100 | $41,600 | $213,500 |
Source: Public Records
Map
Nearby Homes
- 12 Walden Ln
- 8 Walden Ln
- 8 Walden Ln Unit 8
- 14 Walden Ln
- 6 Walden Ln
- 16 Walden Ln
- 4 Walden Ln
- 4 Walden Ln Unit 46
- 0 Walden Ln Unit 29 145178
- 0 Walden Ln Unit 9 145625
- 0 Walden Ln Unit 9
- 18 Walden Ln
- 11 Walden Ln
- 11 Walden La Unit 11
- 2 Walden Ln
- 9 Walden Ln
- 13 Walden Ln
- 13 Walden La Unit 13
- 20 Walden Ln
- 5 Walden Ln
Your Personal Tour Guide
Ask me questions while you tour the home.