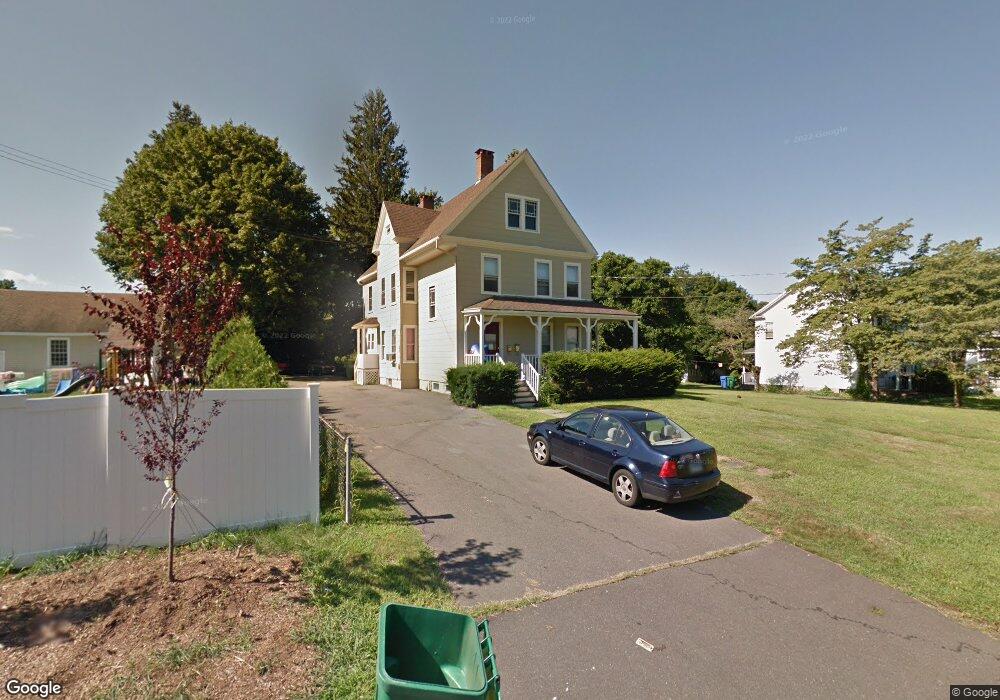
10 Wall St Cromwell, CT 06416
Estimated Value: $329,000 - $452,000
6
Beds
4
Baths
2,836
Sq Ft
$143/Sq Ft
Est. Value
About This Home
This home is located at 10 Wall St, Cromwell, CT 06416 and is currently estimated at $404,767, approximately $142 per square foot. 10 Wall St is a home located in Middlesex County with nearby schools including Edna C. Stevens School, Woodside Intermediate School, and Cromwell Middle School.
Ownership History
Date
Name
Owned For
Owner Type
Purchase Details
Closed on
Jun 16, 2004
Sold by
Mancarella Thomas J and Mancarella Esther R
Bought by
Wojciechowski Matthew and Wojciechowski Catherine S
Current Estimated Value
Home Financials for this Owner
Home Financials are based on the most recent Mortgage that was taken out on this home.
Original Mortgage
$192,250
Interest Rate
6.12%
Mortgage Type
Purchase Money Mortgage
Purchase Details
Closed on
Aug 30, 1989
Sold by
Kellum Marie I
Bought by
Mancarella Thomas J
Purchase Details
Closed on
Nov 18, 1988
Sold by
Pitruzzello Philip
Bought by
Kellum Marie I
Create a Home Valuation Report for This Property
The Home Valuation Report is an in-depth analysis detailing your home's value as well as a comparison with similar homes in the area
Home Values in the Area
Average Home Value in this Area
Purchase History
| Date | Buyer | Sale Price | Title Company |
|---|---|---|---|
| Wojciechowski Matthew | $255,000 | -- | |
| Wojciechowski Matthew | $255,000 | -- | |
| Mancarella Thomas J | $172,500 | -- | |
| Kellum Marie I | $60,000 | -- |
Source: Public Records
Mortgage History
| Date | Status | Borrower | Loan Amount |
|---|---|---|---|
| Open | Kellum Marie I | $155,500 | |
| Closed | Kellum Marie I | $192,250 | |
| Closed | Kellum Marie I | $50,000 |
Source: Public Records
Tax History
| Year | Tax Paid | Tax Assessment Tax Assessment Total Assessment is a certain percentage of the fair market value that is determined by local assessors to be the total taxable value of land and additions on the property. | Land | Improvement |
|---|---|---|---|---|
| 2025 | $5,733 | $186,200 | $73,360 | $112,840 |
| 2024 | $5,599 | $186,200 | $73,360 | $112,840 |
| 2023 | $5,476 | $186,200 | $73,360 | $112,840 |
| 2022 | $4,820 | $144,620 | $67,550 | $77,070 |
| 2021 | $4,820 | $144,620 | $67,550 | $77,070 |
| 2020 | $4,748 | $144,620 | $67,550 | $77,070 |
| 2019 | $4,748 | $144,620 | $67,550 | $77,070 |
| 2018 | $4,748 | $144,620 | $67,550 | $77,070 |
| 2017 | $5,092 | $150,070 | $63,120 | $86,950 |
| 2016 | $5,047 | $150,070 | $63,120 | $86,950 |
| 2015 | $4,709 | $150,070 | $63,120 | $86,950 |
| 2014 | $4,994 | $150,070 | $63,120 | $86,950 |
Source: Public Records
Map
Nearby Homes
Your Personal Tour Guide
Ask me questions while you tour the home.