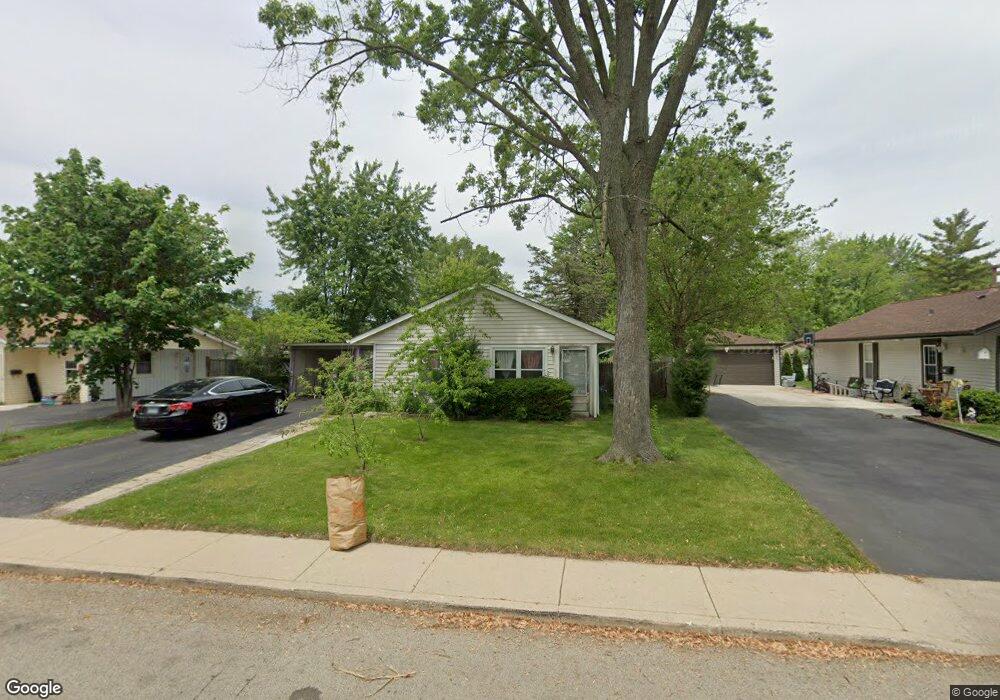
10 Walnut St Carpentersville, IL 60110
Estimated Value: $217,000 - $250,909
3
Beds
--
Bath
960
Sq Ft
$248/Sq Ft
Est. Value
About This Home
This home is located at 10 Walnut St, Carpentersville, IL 60110 and is currently estimated at $237,727, approximately $247 per square foot. 10 Walnut St is a home located in Kane County with nearby schools including Sunny Hill Elementary School, Barrington Middle School Station Campus, and Barrington High School.
Ownership History
Date
Name
Owned For
Owner Type
Purchase Details
Closed on
May 29, 2003
Sold by
Nunez Alejandro
Bought by
Nunez Porfirio and Magallanes Olivia
Current Estimated Value
Home Financials for this Owner
Home Financials are based on the most recent Mortgage that was taken out on this home.
Original Mortgage
$133,934
Outstanding Balance
$61,425
Interest Rate
6.43%
Mortgage Type
FHA
Estimated Equity
$176,302
Purchase Details
Closed on
Nov 5, 2002
Sold by
Saavedra Agustin
Bought by
Nunez Alejandro
Home Financials for this Owner
Home Financials are based on the most recent Mortgage that was taken out on this home.
Original Mortgage
$95,000
Interest Rate
6.08%
Purchase Details
Closed on
Jul 30, 1999
Sold by
Patrick Jimmy
Bought by
Nunez Alejandro and Saavedra Agustin
Home Financials for this Owner
Home Financials are based on the most recent Mortgage that was taken out on this home.
Original Mortgage
$87,865
Interest Rate
7.7%
Mortgage Type
FHA
Create a Home Valuation Report for This Property
The Home Valuation Report is an in-depth analysis detailing your home's value as well as a comparison with similar homes in the area
Home Values in the Area
Average Home Value in this Area
Purchase History
| Date | Buyer | Sale Price | Title Company |
|---|---|---|---|
| Nunez Porfirio | $139,000 | Chicago Title Insurance Comp | |
| Nunez Alejandro | -- | World Title Guaranty Inc | |
| Nunez Alejandro | $88,000 | -- |
Source: Public Records
Mortgage History
| Date | Status | Borrower | Loan Amount |
|---|---|---|---|
| Open | Nunez Porfirio | $133,934 | |
| Closed | Nunez Alejandro | $95,000 | |
| Previous Owner | Nunez Alejandro | $87,865 |
Source: Public Records
Tax History Compared to Growth
Tax History
| Year | Tax Paid | Tax Assessment Tax Assessment Total Assessment is a certain percentage of the fair market value that is determined by local assessors to be the total taxable value of land and additions on the property. | Land | Improvement |
|---|---|---|---|---|
| 2024 | $4,649 | $68,165 | $12,553 | $55,612 |
| 2023 | $4,408 | $61,333 | $11,295 | $50,038 |
| 2022 | $4,071 | $53,393 | $11,295 | $42,098 |
| 2021 | $3,901 | $50,414 | $10,665 | $39,749 |
| 2020 | $3,714 | $49,280 | $10,425 | $38,855 |
| 2019 | $3,496 | $46,782 | $9,897 | $36,885 |
| 2018 | $2,990 | $39,410 | $9,701 | $29,709 |
| 2017 | $2,761 | $36,866 | $9,075 | $27,791 |
| 2016 | $2,426 | $31,805 | $8,787 | $23,018 |
| 2015 | -- | $25,933 | $8,234 | $17,699 |
| 2014 | -- | $23,373 | $8,007 | $15,366 |
| 2013 | -- | $24,088 | $8,252 | $15,836 |
Source: Public Records
Map
Nearby Homes
- 140 Hickory Dr
- 103 Hickory Dr
- 1426 Kings Rd
- 944 Cortney Dr
- 105 Siesta Rd
- 57 Robin Rd
- 336 Delaware St
- 94 Wren Rd
- 200 Amarillo Dr
- 7 Austin Ave
- 7 Hickory Dr
- 4 Austin Ave
- 308 Amarillo Ct
- 149 Austin Ave
- 171 Lake Shore Dr
- 327 Tulsa Ave
- 1811 IL Rte 25 (Elgin) Rd
- 181 Skyline Dr
- 2013 Silverstone Dr Unit 2013
- 1431 Silverstone Dr Unit 1416