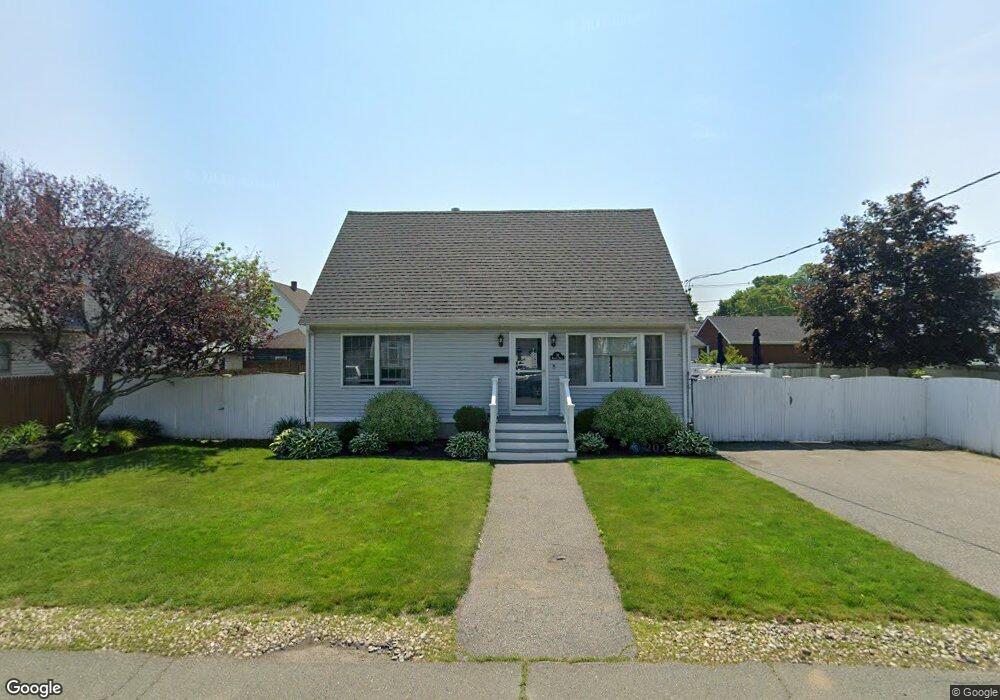
10 Welcome St Peabody, MA 01960
South Peabody NeighborhoodEstimated Value: $604,000 - $774,000
2
Beds
1
Bath
1,428
Sq Ft
$482/Sq Ft
Est. Value
About This Home
This home is located at 10 Welcome St, Peabody, MA 01960 and is currently estimated at $688,423, approximately $482 per square foot. 10 Welcome St is a home located in Essex County with nearby schools including Peabody Veterans Memorial High School, North Shore Christian School, and St John The Baptist School.
Ownership History
Date
Name
Owned For
Owner Type
Purchase Details
Closed on
Jun 30, 2000
Sold by
Diantgikis James and Diantgikis Mary G
Bought by
Fisher Dean W and Leblanc Ann M
Current Estimated Value
Purchase Details
Closed on
Dec 28, 1988
Sold by
Cbw Realty Tr
Bought by
Diantgikis James
Purchase Details
Closed on
Aug 9, 1988
Sold by
Pascucci Ron J
Bought by
Cbw Realty Trust
Create a Home Valuation Report for This Property
The Home Valuation Report is an in-depth analysis detailing your home's value as well as a comparison with similar homes in the area
Home Values in the Area
Average Home Value in this Area
Purchase History
| Date | Buyer | Sale Price | Title Company |
|---|---|---|---|
| Fisher Dean W | $227,900 | -- | |
| Diantgikis James | $145,000 | -- | |
| Cbw Realty Trust | $473,000 | -- |
Source: Public Records
Mortgage History
| Date | Status | Borrower | Loan Amount |
|---|---|---|---|
| Open | Cbw Realty Trust | $254,000 | |
| Closed | Cbw Realty Trust | $270,200 |
Source: Public Records
Tax History Compared to Growth
Tax History
| Year | Tax Paid | Tax Assessment Tax Assessment Total Assessment is a certain percentage of the fair market value that is determined by local assessors to be the total taxable value of land and additions on the property. | Land | Improvement |
|---|---|---|---|---|
| 2025 | $5,769 | $623,000 | $239,000 | $384,000 |
| 2024 | $5,463 | $599,000 | $239,000 | $360,000 |
| 2023 | $5,389 | $566,100 | $213,400 | $352,700 |
| 2022 | $5,069 | $501,900 | $190,600 | $311,300 |
| 2021 | $4,691 | $447,200 | $173,300 | $273,900 |
| 2020 | $4,478 | $416,900 | $173,300 | $243,600 |
| 2019 | $4,293 | $389,900 | $173,300 | $216,600 |
| 2018 | $4,017 | $350,500 | $157,500 | $193,000 |
| 2017 | $3,900 | $331,600 | $157,500 | $174,100 |
| 2016 | $3,743 | $314,000 | $157,500 | $156,500 |
| 2015 | $3,389 | $275,500 | $153,600 | $121,900 |
Source: Public Records
Map
Nearby Homes