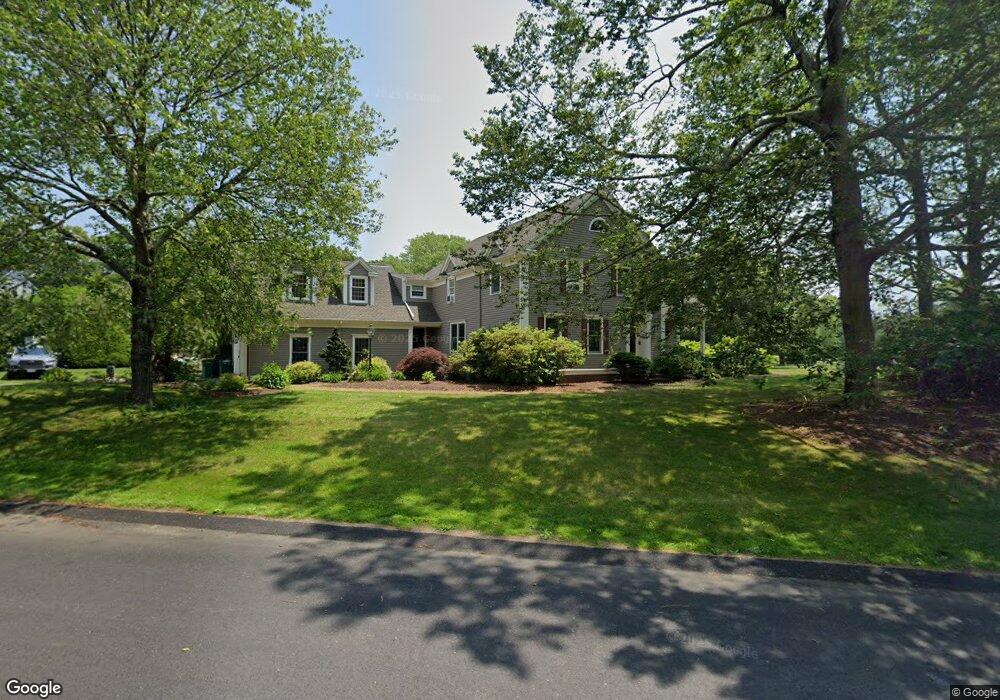
10 Wenlock Cir North Easton, MA 02356
Estimated Value: $1,044,000 - $1,197,000
4
Beds
4
Baths
3,707
Sq Ft
$303/Sq Ft
Est. Value
About This Home
This home is located at 10 Wenlock Cir, North Easton, MA 02356 and is currently estimated at $1,122,654, approximately $302 per square foot. 10 Wenlock Cir is a home located in Bristol County with nearby schools including Easton Middle School.
Ownership History
Date
Name
Owned For
Owner Type
Purchase Details
Closed on
Nov 21, 2017
Sold by
Efremidis Charles T
Bought by
Easton Coastal T and Charles
Current Estimated Value
Purchase Details
Closed on
Jun 3, 2009
Sold by
Thor Rt and Efremidis
Bought by
Efremidis Charles T
Home Financials for this Owner
Home Financials are based on the most recent Mortgage that was taken out on this home.
Original Mortgage
$315,070
Interest Rate
4.83%
Mortgage Type
Purchase Money Mortgage
Purchase Details
Closed on
Aug 19, 2008
Sold by
Efremidis Charles
Bought by
Thor Rt and Efremidis
Purchase Details
Closed on
May 23, 2008
Sold by
Wenlock Circle T
Bought by
Efremidis Charles
Purchase Details
Closed on
Oct 19, 2006
Sold by
Wenlock Circle T and Pavao
Bought by
Rego George
Purchase Details
Closed on
Jun 17, 1993
Sold by
Deibel Peter J and Deibel Kathleen M
Bought by
Renaud Richard R and Renaud Nancy S
Create a Home Valuation Report for This Property
The Home Valuation Report is an in-depth analysis detailing your home's value as well as a comparison with similar homes in the area
Home Values in the Area
Average Home Value in this Area
Purchase History
| Date | Buyer | Sale Price | Title Company |
|---|---|---|---|
| Easton Coastal T | -- | -- | |
| Easton Coastal T | -- | -- | |
| Efremidis Charles T | -- | -- | |
| Efremidis Charles T | -- | -- | |
| Efremidis Charles T | -- | -- | |
| Thor Rt | -- | -- | |
| Thor Rt | -- | -- | |
| Efremidis Charles | $425,000 | -- | |
| Efremidis Charles | $425,000 | -- | |
| Rego George | $775,000 | -- | |
| Rego George | $775,000 | -- | |
| Renaud Richard R | $420,000 | -- | |
| Renaud Richard R | $420,000 | -- |
Source: Public Records
Mortgage History
| Date | Status | Borrower | Loan Amount |
|---|---|---|---|
| Previous Owner | Efremidis Charles T | $315,070 |
Source: Public Records
Tax History Compared to Growth
Tax History
| Year | Tax Paid | Tax Assessment Tax Assessment Total Assessment is a certain percentage of the fair market value that is determined by local assessors to be the total taxable value of land and additions on the property. | Land | Improvement |
|---|---|---|---|---|
| 2025 | $12,107 | $970,100 | $442,900 | $527,200 |
| 2024 | $12,190 | $913,100 | $390,600 | $522,500 |
| 2023 | $12,015 | $823,500 | $371,200 | $452,300 |
| 2022 | $11,367 | $738,600 | $303,100 | $435,500 |
| 2021 | $10,873 | $702,400 | $266,900 | $435,500 |
| 2020 | $10,611 | $689,900 | $266,900 | $423,000 |
| 2019 | $10,757 | $674,000 | $266,300 | $407,700 |
| 2018 | $10,434 | $653,100 | $271,200 | $381,900 |
| 2017 | $10,178 | $627,500 | $271,200 | $356,300 |
| 2016 | $10,179 | $628,700 | $289,200 | $339,500 |
| 2015 | $9,632 | $574,000 | $234,500 | $339,500 |
| 2014 | $9,590 | $576,000 | $240,700 | $335,300 |
Source: Public Records
Map
Nearby Homes
- 89 Massapoag Ave
- 6 Kingsley Rd
- 98 Massapoag Ave
- 218 Massapoag Ave
- 37 Kingsley Rd
- 29 Owl Ridge Rd
- 260 Massapoag Ave
- 3 Nicole Rd
- 15 Randall Farm Dr
- 45 Randall St
- 1 Whittier Ln Unit 1
- 79 Summer St
- 18 Prudence Crandall Ln Unit 18
- 73 Summer St
- 34 Kevins Way
- 4 Eagle Rock Rd
- 9 Oak Ridge Dr
- 23 Estelle Marsan Dr
- 30 King Arthur Rd
- 32 Spooner St
- 6 Wenlock Cir
- 9 Wenlock Cir
- 2 Wenlock Cir
- 5 Wenlock Cir
- 33 Hillington Dr
- 36 Hillington Dr
- 32 Hillington Dr
- 19 Wenlock Cir
- 29 Hillington Dr
- 3 Wenlock Cir
- 109 Allen Rd
- 105 Allen Rd
- 12 Copperfield Ave
- 113 Allen Rd
- 20 Wenlock Cir
- 16 Copperfield Ave
- 20 Wenlock Cir Hillington Estates
- 28 Hillington Dr
- 8 Copperfield Ave
- 23 Wenlock Cir