
Seller's Agent in 2014
Pat Bagni-Latimer
MA Real Estate Center
(978) 815-6965
33 in this area
72 Total Sales
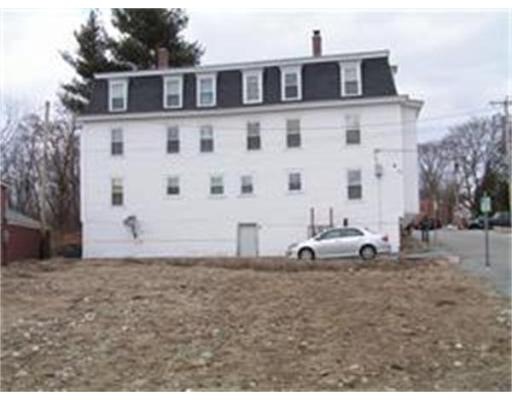
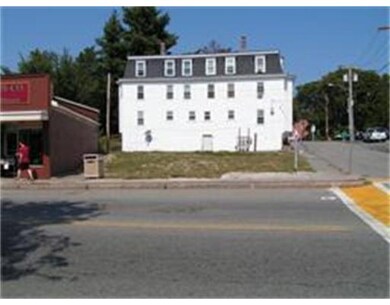
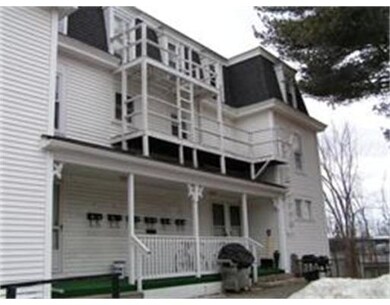
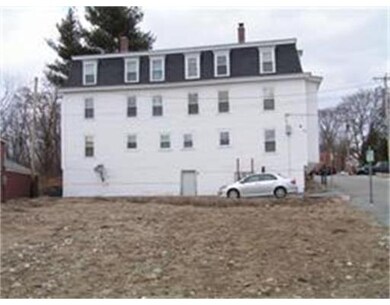
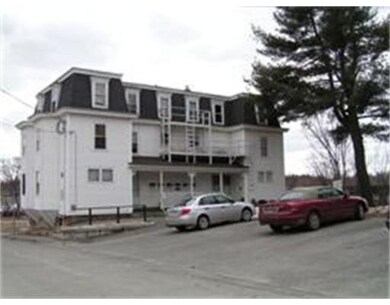
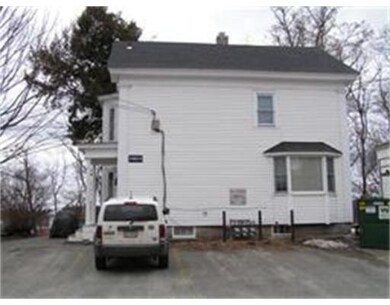
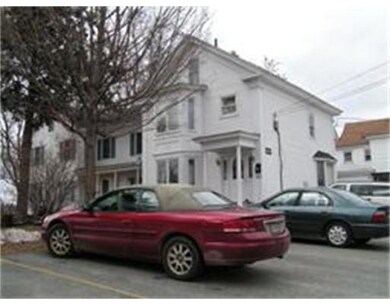
This a group of parcels containing 1- 6 family, 1- 3 family and 1-vacant lot. The 2 multi family property have a gross income of $7710 per month. There are 6 1 bedroom units, 2 2 bedroom units and 1 three bedroom units in total. The vacant lot is zoned downtown business which allows for commercial space with residential overhead. The parcels are located across the street from the Boston T commuter station in Downtown Ayer. Tenants have separate utilities.
Home Type
Multi-Family
Year Built
1920
Lot Details
0.38 Acres
| Date | Event | Price | List to Sale | Price per Sq Ft |
|---|---|---|---|---|
| 07/31/2014 07/31/14 | Sold | $605,000 | -19.2% | $83 / Sq Ft |
| 07/01/2014 07/01/14 | Pending | -- | -- | -- |
| 03/28/2014 03/28/14 | For Sale | $749,000 | -- | $102 / Sq Ft |
| Year | Tax Paid | Tax Assessment Tax Assessment Total Assessment is a certain percentage of the fair market value that is determined by local assessors to be the total taxable value of land and additions on the property. | Land | Improvement |
|---|---|---|---|---|
| 2025 | $7,077 | $591,700 | $124,300 | $467,400 |
| 2024 | $6,164 | $503,200 | $124,300 | $378,900 |
| 2023 | $5,908 | $475,700 | $116,400 | $359,300 |
| 2022 | $6,014 | $448,100 | $101,400 | $346,700 |
| 2021 | $159 | $403,600 | $92,800 | $310,800 |
| 2020 | $5,410 | $383,700 | $89,400 | $294,300 |
| 2019 | $11,607 | $367,600 | $85,200 | $282,400 |
| 2018 | $153 | $320,400 | $82,700 | $237,700 |
| 2017 | $4,510 | $313,400 | $70,300 | $243,100 |
| 2016 | $4,262 | $293,300 | $76,800 | $216,500 |
| 2015 | $4,097 | $280,200 | $82,000 | $198,200 |
| 2014 | $3,945 | $280,200 | $82,000 | $198,200 |
Seller's Agent in 2014
Pat Bagni-Latimer
MA Real Estate Center
(978) 815-6965
33 in this area
72 Total Sales
Source: MLS Property Information Network (MLS PIN)
MLS Number: 71651247
Disclaimer: Certain information contained herein is derived from information provided by parties other than Homes.com. All information provided is deemed reliable, but is not guaranteed to be accurate and should be independently verified.
![]() The property listing data and information, or the Images, set forth herein were provided to MLS Property Information Network, Inc. from third party sources, including sellers, lessors and public records, and were compiled by MLS Property Information Network, Inc. The property listing data and information, and the Images, are for the personal, non-commercial use of consumers having a good faith interest in purchasing or leasing listed properties of the type displayed to them and may not be used for any purpose other than to identify prospective properties which such consumers may have a good faith interest in purchasing or leasing. MLS Property Information Network, Inc. and its subscribers disclaim any and all representations and warranties as to the accuracy of the property listing data and information, or as to the accuracy of any of the Images, set forth herein.
The property listing data and information, or the Images, set forth herein were provided to MLS Property Information Network, Inc. from third party sources, including sellers, lessors and public records, and were compiled by MLS Property Information Network, Inc. The property listing data and information, and the Images, are for the personal, non-commercial use of consumers having a good faith interest in purchasing or leasing listed properties of the type displayed to them and may not be used for any purpose other than to identify prospective properties which such consumers may have a good faith interest in purchasing or leasing. MLS Property Information Network, Inc. and its subscribers disclaim any and all representations and warranties as to the accuracy of the property listing data and information, or as to the accuracy of any of the Images, set forth herein.
Ask me questions while you tour the home.