


10 Weston Way West Long Branch, NJ 07764
Estimated payment $28,334/month
Highlights
- Pool House
- 3.24 Acre Lot
- Cul-De-Sac
- Shore Regional High School Rated A-
- Wooded Lot
- Lot Has A Rolling Slope
About This Lot
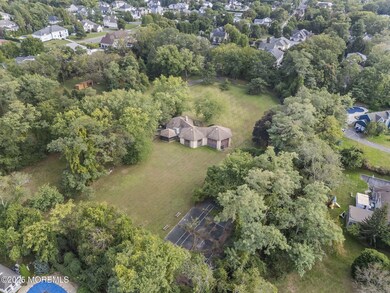
A Once-in-a-Generation Land Offering!
10 WESTON WAY is a PREMIER 3.24-acre property offering endless Privacy, Exclusivity, and Potential in one of Monmouth County's most desirable locations. Privately situated at the end of a tree-lined cul-de-sac, this One-of-a-Kind property offers the opportunity to design and build - whether envisioned as a grand private residence, a multi-home compound, or a signature development project (subject to town approvals). Just minutes from the Jersey Shore and the coastal destinations of Deal, Asbury Park, and Long Branch, this property offers the ideal balance of seclusion and accessibility. Close to oceanfront dining, shopping, only steps from local houses of worship, and barely an hour from New York City. Whether you are a developer envisioning a landmark project, a visionary builder, or a discerning homeowner ready to create your dream home, 10 WESTON WAY offers a setting that simply can NOT BE REPLICATED. A Rare Opportunity to Create Something Extraordinary in a Truly Unmatched Setting. Existing Home Conveys As-Is.
Property Details
Property Type
- Land
Est. Annual Taxes
- $24,711
Lot Details
- 3.24 Acre Lot
- Cul-De-Sac
- Lot Has A Rolling Slope
- Wooded Lot
Pool
- Pool House
Schools
- Frank Antonides Middle School
- Shore Reg High School
Utilities
- Electricity To Lot Line
- Gas Available
- Cable TV Available
Listing and Financial Details
- Assessor Parcel Number 53-00061-0000-00048-04
Map
Home Values in the Area
Average Home Value in this Area
Tax History
| Year | Tax Paid | Tax Assessment Tax Assessment Total Assessment is a certain percentage of the fair market value that is determined by local assessors to be the total taxable value of land and additions on the property. | Land | Improvement |
|---|---|---|---|---|
| 2025 | $24,711 | $2,232,000 | $1,641,600 | $590,400 |
| 2024 | $22,133 | $1,896,500 | $1,225,800 | $670,700 |
| 2023 | $22,133 | $1,584,300 | $932,400 | $651,900 |
| 2022 | $22,842 | $1,431,600 | $814,500 | $617,100 |
| 2021 | $22,842 | $1,181,700 | $731,000 | $450,700 |
| 2020 | $23,452 | $1,141,200 | $789,800 | $351,400 |
| 2019 | $23,240 | $1,137,000 | $789,800 | $347,200 |
| 2018 | $23,678 | $1,119,000 | $789,800 | $329,200 |
| 2017 | $24,538 | $1,107,300 | $789,800 | $317,500 |
| 2016 | $23,892 | $1,100,000 | $789,800 | $310,200 |
| 2015 | $29,397 | $1,351,600 | $1,000,400 | $351,200 |
| 2014 | $30,466 | $1,307,000 | $972,000 | $335,000 |
Property History
| Date | Event | Price | List to Sale | Price per Sq Ft |
|---|---|---|---|---|
| 10/16/2025 10/16/25 | For Sale | $5,000,000 | -- | -- |
Purchase History
| Date | Type | Sale Price | Title Company |
|---|---|---|---|
| Interfamily Deed Transfer | -- | None Available | |
| Deed | -- | None Listed On Document | |
| Interfamily Deed Transfer | -- | None Available | |
| Deed | -- | None Available | |
| Deed | -- | None Available |
Source: MOREMLS (Monmouth Ocean Regional REALTORS®)
MLS Number: 22531275
APN: 53-00061-0000-00048-04
Disclaimer: Certain information contained herein is derived from information provided by parties other than Homes.com. All information provided is deemed reliable, but is not guaranteed to be accurate and should be independently verified.
![]() IDX information is provided exclusively for personal, non-commercial use, and may not be used for any purpose other than to identify prospective properties consumers may be interested in purchasing.
IDX information is provided exclusively for personal, non-commercial use, and may not be used for any purpose other than to identify prospective properties consumers may be interested in purchasing.
Information is deemed reliable but not guaranteed.
- 20 S Arlene Dr
- 7 De Camp Ct
- 530 Wall St
- 22 Meadow Ln
- 16 Muncy Dr
- 21 Old Queens Ct
- 469 Wall St
- 36 Jamestown Dr Unit ID1239744P
- 28 Musket Ln
- 5 Arlene Dr
- 87 Cooper Ave
- 24 Valley Forge Rd
- 13 Valley Forge Rd
- 10 Avalon Ct
- 63 Jamestown Dr
- 205 Locust Ave
- 57 Fulton Ave
- 142 Locust Ave
- 28 Ridge Rd
- 555 Cedar Ave
