Estimated Value: $89,000 - $113,000
2
Beds
1
Bath
894
Sq Ft
$113/Sq Ft
Est. Value
About This Home
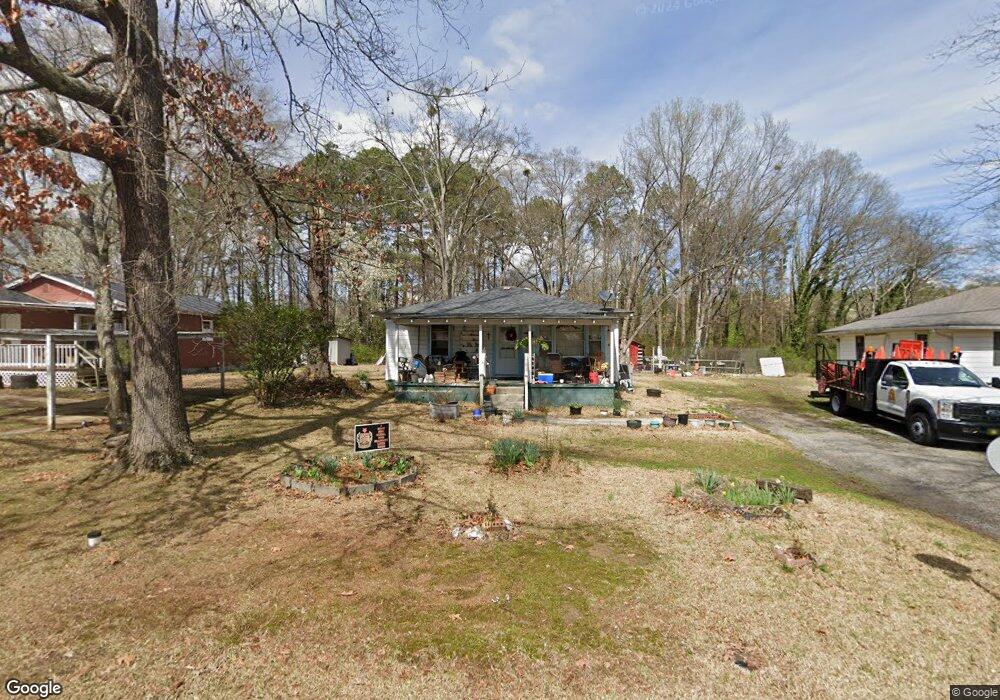
This home is located at 10 Wilkins St NW, Rome, GA 30165 and is currently estimated at $100,672, approximately $112 per square foot. 10 Wilkins St NW is a home located in Floyd County with nearby schools including Rome High School.
Ownership History
Date
Name
Owned For
Owner Type
Purchase Details
Closed on
May 18, 2011
Sold by
Secretary Of Housing
Bought by
Martinez Juana
Current Estimated Value
Home Financials for this Owner
Home Financials are based on the most recent Mortgage that was taken out on this home.
Original Mortgage
$17,000
Interest Rate
4.79%
Mortgage Type
New Conventional
Purchase Details
Closed on
Jul 6, 2010
Sold by
Nationwide Advantage Mortgage Company
Bought by
Secretary Of Housing And Urban Developme
Purchase Details
Closed on
May 31, 2007
Sold by
Not Provided
Bought by
Martinez Juana
Home Financials for this Owner
Home Financials are based on the most recent Mortgage that was taken out on this home.
Original Mortgage
$52,968
Interest Rate
6.12%
Mortgage Type
FHA
Purchase Details
Closed on
Sep 9, 2002
Sold by
Humphries Dan W
Bought by
Bowden Jennifer Humphries
Purchase Details
Closed on
Jun 8, 1993
Sold by
Barnett Dora Kelley
Bought by
Humphries Dan W
Purchase Details
Closed on
Feb 6, 1989
Bought by
Barnett Dora Kelley
Create a Home Valuation Report for This Property
The Home Valuation Report is an in-depth analysis detailing your home's value as well as a comparison with similar homes in the area
Home Values in the Area
Average Home Value in this Area
Purchase History
| Date | Buyer | Sale Price | Title Company |
|---|---|---|---|
| Martinez Juana | $20,000 | -- | |
| Secretary Of Housing And Urban Developme | $57,500 | -- | |
| Martinez Juana | -- | -- | |
| Martinez Juana | $53,800 | -- | |
| Bowden Jennifer Humphries | -- | -- | |
| Humphries Dan W | $25,000 | -- | |
| Barnett Dora Kelley | -- | -- |
Source: Public Records
Mortgage History
| Date | Status | Borrower | Loan Amount |
|---|---|---|---|
| Closed | Martinez Juana | $17,000 | |
| Previous Owner | Martinez Juana | $52,968 |
Source: Public Records
Tax History Compared to Growth
Tax History
| Year | Tax Paid | Tax Assessment Tax Assessment Total Assessment is a certain percentage of the fair market value that is determined by local assessors to be the total taxable value of land and additions on the property. | Land | Improvement |
|---|---|---|---|---|
| 2024 | $725 | $25,234 | $9,330 | $15,904 |
| 2023 | $704 | $24,386 | $8,482 | $15,904 |
| 2022 | $699 | $22,690 | $6,786 | $15,904 |
| 2021 | $583 | $22,690 | $6,786 | $15,904 |
| 2020 | $673 | $20,288 | $5,302 | $14,986 |
| 2019 | $651 | $19,347 | $5,302 | $14,045 |
| 2018 | $635 | $18,428 | $5,302 | $13,126 |
| 2017 | $662 | $17,868 | $5,302 | $12,566 |
| 2016 | $648 | $17,440 | $5,280 | $12,160 |
| 2015 | $612 | $17,440 | $5,280 | $12,160 |
| 2014 | $612 | $17,440 | $5,280 | $12,160 |
Source: Public Records
Map
Nearby Homes
- 18 Butler Cir NW
- 15 Alexander St
- 209 Larkspur Ln SW
- 15 John Ross Dr SW
- 16 Jefferson Dr SW
- 43 Westwood Cir SW
- 23 Westwillow Ln NW
- 3 Oak Ridge Ct NE
- 200 Coosawattee Ave SW
- 0 Cedartown Rd Unit 10479932
- 2602 Lakeridge Cir NW
- 40 Westwood Cir SW
- 100 Dellwood Dr NW
- 4 Homestead Cir NW
- 216 Coosawattee Ave SW
- 103 Wooten Dr SW
- 25 Ridge Dr SW
- 118 Melody Ln NW
- 12 Wilkins St NW
- 8 Wilkins St NW
- 14 Wilkins St NW
- 0 Betty Kay Ave Unit 8013598
- 0 Betty Kay Ave Unit 8915019
- 0 Betty Kay Ave Unit 3263910
- 0 Betty Kay Ave Unit 7554435
- 11 Wilkins St NW
- 9 Wilkins St NW
- 18 Wilkins St NW
- 0 Fox Hill Dr SW Unit 7377723
- 0 Fox Hill Dr SW
- 13 Wilkins St NW
- 100 Wilkins St
- 4 Wilkins St NW
- 20 Wilkins St NW
- 19 Butler Cir NW
- 215 Old Airport Rd NW
- 215 Old Airport Rd NW
- 7 W Butler St NW