10 Willard Rd Weston, MA 02493
Estimated Value: $1,431,276 - $2,115,000
4
Beds
2
Baths
1,860
Sq Ft
$889/Sq Ft
Est. Value
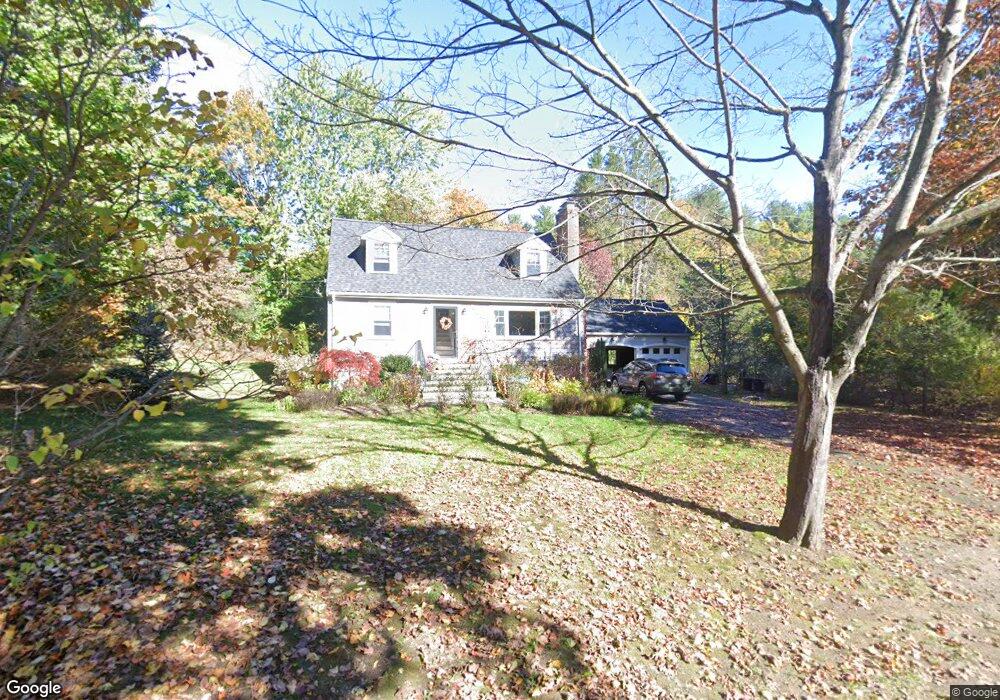
About This Home
This home is located at 10 Willard Rd, Weston, MA 02493 and is currently estimated at $1,653,069, approximately $888 per square foot. 10 Willard Rd is a home located in Middlesex County with nearby schools including Country Elementary School, Woodland Elementary School, and Field Elementary School.
Ownership History
Date
Name
Owned For
Owner Type
Purchase Details
Closed on
Dec 11, 2019
Sold by
Mulvey Robert J and Mulvey Joyce M
Bought by
Mulvey Irt
Current Estimated Value
Purchase Details
Closed on
Dec 15, 2004
Sold by
Mulvey Robert J
Bought by
Mulvey Joyce M and Mulvey Robert J
Purchase Details
Closed on
Nov 16, 1977
Bought by
Mulvey Robert J
Create a Home Valuation Report for This Property
The Home Valuation Report is an in-depth analysis detailing your home's value as well as a comparison with similar homes in the area
Home Values in the Area
Average Home Value in this Area
Purchase History
| Date | Buyer | Sale Price | Title Company |
|---|---|---|---|
| Mulvey Irt | -- | None Available | |
| Mulvey Joyce M | -- | -- | |
| Mulvey Robert J | $67,600 | -- |
Source: Public Records
Mortgage History
| Date | Status | Borrower | Loan Amount |
|---|---|---|---|
| Previous Owner | Mulvey Robert J | $100,000 | |
| Previous Owner | Mulvey Robert J | $100,000 |
Source: Public Records
Tax History
| Year | Tax Paid | Tax Assessment Tax Assessment Total Assessment is a certain percentage of the fair market value that is determined by local assessors to be the total taxable value of land and additions on the property. | Land | Improvement |
|---|---|---|---|---|
| 2025 | $11,531 | $1,038,800 | $647,100 | $391,700 |
| 2024 | $11,315 | $1,017,500 | $647,100 | $370,400 |
| 2023 | $11,292 | $953,700 | $647,100 | $306,600 |
| 2022 | $11,082 | $865,100 | $616,700 | $248,400 |
| 2021 | $9,988 | $769,500 | $531,600 | $237,900 |
| 2020 | $10,514 | $819,500 | $531,700 | $287,800 |
| 2019 | $9,774 | $776,300 | $492,000 | $284,300 |
| 2018 | $9,712 | $776,300 | $492,000 | $284,300 |
| 2017 | $9,626 | $776,300 | $492,000 | $284,300 |
| 2016 | $9,239 | $759,800 | $492,000 | $267,800 |
| 2015 | $8,955 | $729,200 | $468,900 | $260,300 |
Source: Public Records
Map
Nearby Homes
- 35 Bemis St
- 59 Bradyll Rd
- 40 Bakers Hill Rd
- 46 Blackburnian Rd
- 6 Clifford Ln
- 416 Conant Rd
- 15 Myles Standish Rd
- 156 Cherry Brook Rd
- 173 Conant Rd
- 81 Montvale Rd
- 100 Bradford Rd
- 11 Winthrop Cir
- 130 Tower Rd
- 183 Kings Grant Rd
- 63 Sudbury Rd
- 19 Jericho Rd
- 8 Silver Hill Rd
- 55 Forest Ridge Rd
- 77 Old County Rd
- 45 Winter St
Your Personal Tour Guide
Ask me questions while you tour the home.