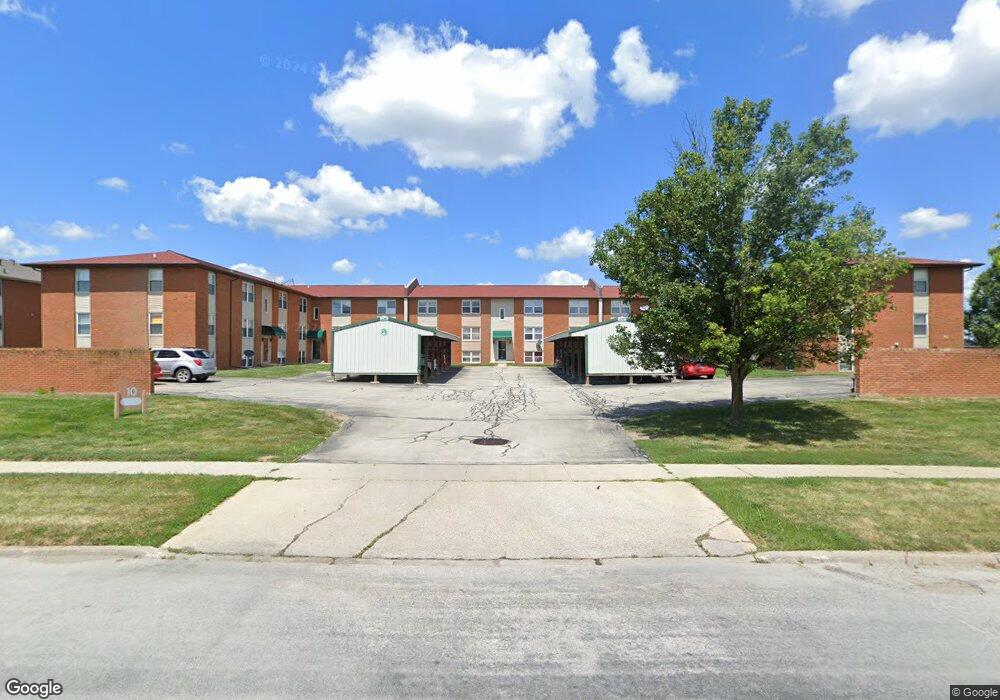
10 Willedrob Rd Unit 12 UNIT 12 Bloomington, IL 61701
Estimated Value: $64,813 - $77,000
2
Beds
1
Bath
810
Sq Ft
$87/Sq Ft
Est. Value
About This Home
This home is located at 10 Willedrob Rd Unit 12 UNIT 12, Bloomington, IL 61701 and is currently estimated at $70,703, approximately $87 per square foot. 10 Willedrob Rd Unit 12 UNIT 12 is a home located in McLean County with nearby schools including Oakland Elementary School, Bloomington Junior High School, and Bloomington High School.
Ownership History
Date
Name
Owned For
Owner Type
Purchase Details
Closed on
Dec 30, 2019
Sold by
Fm Building Management Inc
Bought by
Fmb Holding Inc
Current Estimated Value
Purchase Details
Closed on
Jan 24, 2018
Sold by
Bayview Loan Servicing Llc
Bought by
Fm Boulding Management Inc
Purchase Details
Closed on
Dec 6, 2017
Sold by
Komnick Kaitlynn
Bought by
Bayview Loan Servicing Llc
Purchase Details
Closed on
Mar 23, 2012
Sold by
Mechling Katherine R and Mechling Stephen M
Bought by
Mehrojkulov Faredun
Purchase Details
Closed on
Mar 13, 2009
Sold by
Furler Justine M
Bought by
Komnick Kaitlynn
Home Financials for this Owner
Home Financials are based on the most recent Mortgage that was taken out on this home.
Original Mortgage
$69,962
Interest Rate
5.09%
Create a Home Valuation Report for This Property
The Home Valuation Report is an in-depth analysis detailing your home's value as well as a comparison with similar homes in the area
Home Values in the Area
Average Home Value in this Area
Purchase History
| Date | Buyer | Sale Price | Title Company |
|---|---|---|---|
| Fmb Holding Inc | -- | None Available | |
| Fm Boulding Management Inc | $38,000 | Chicago Title Ins | |
| Bayview Loan Servicing Llc | -- | Attorney | |
| Mehrojkulov Faredun | $50,000 | None Available | |
| Komnick Kaitlynn | $72,500 | Frontier Title Co |
Source: Public Records
Mortgage History
| Date | Status | Borrower | Loan Amount |
|---|---|---|---|
| Previous Owner | Komnick Kaitlynn | $69,962 |
Source: Public Records
Tax History Compared to Growth
Tax History
| Year | Tax Paid | Tax Assessment Tax Assessment Total Assessment is a certain percentage of the fair market value that is determined by local assessors to be the total taxable value of land and additions on the property. | Land | Improvement |
|---|---|---|---|---|
| 2024 | $1,547 | $21,521 | $1,839 | $19,682 |
| 2022 | $1,547 | $18,199 | $1,556 | $16,643 |
| 2021 | $1,449 | $17,052 | $1,458 | $15,594 |
| 2020 | $1,417 | $16,717 | $1,429 | $15,288 |
| 2019 | $1,413 | $16,717 | $1,429 | $15,288 |
| 2018 | $1,349 | $16,024 | $1,429 | $14,595 |
| 2017 | $1,524 | $18,104 | $1,429 | $16,675 |
| 2016 | $960 | $17,424 | $1,375 | $16,049 |
| 2015 | $990 | $17,816 | $1,406 | $16,410 |
| 2014 | -- | $17,816 | $1,406 | $16,410 |
| 2013 | -- | $18,938 | $1,818 | $17,120 |
Source: Public Records
Map
Nearby Homes
- 10 Willedrob Rd Unit 26
- 2204 E Lincoln St Unit 13
- 904 Snyder Dr
- 802 S Mercer Ave
- 500 S Prospect Rd
- 2001 Cloud St
- 1910 Garling Dr
- 2907 Pheasant Run
- 1005 S Hershey Rd
- 1909 Marzel Dr
- 21 Pendleton Way
- 63 Brookshire Green
- 1513 E Grove St
- 1811 E Lincoln St
- 2501 Yorktown Dr
- 2603 Wellington Way
- 504 Kreitzer Ave
- 3 Kenfield Cir
- 20 Brompton Ct
- 2419 Maloney Dr
- 10 Willedrob Rd Unit 18
- 10 Willedrob Rd Unit 11
- 10 Willedrob Rd Unit 10
- 10 Willedrob Rd Unit 22
- 10 Willedrob Rd Unit 21
- 10 Willedrob Rd Unit 19
- 10 Willedrob Rd Unit 14
- 10 Willedrob Rd Unit 12
- 10 Willedrob Rd Unit 9
- 10 Willedrob Rd Unit 6
- 10 Willedrob Rd Unit 5
- 10 Willedrob Rd Unit 4
- 10 Willedrob Rd Unit 3
- 10 Willedrob Rd Unit 2
- 10 Willedrob Rd Unit 1
- 10 Willedrob Rd Unit 30
- 10 Willedrob Rd Unit 29
- 10 Willedrob Rd Unit 28
- 10 Willedrob Rd Unit 27
- 10 Willedrob Rd Unit 25