R
Seller's Agent in 2020
Richard Hirtle
Hart Realty
2 Total Sales
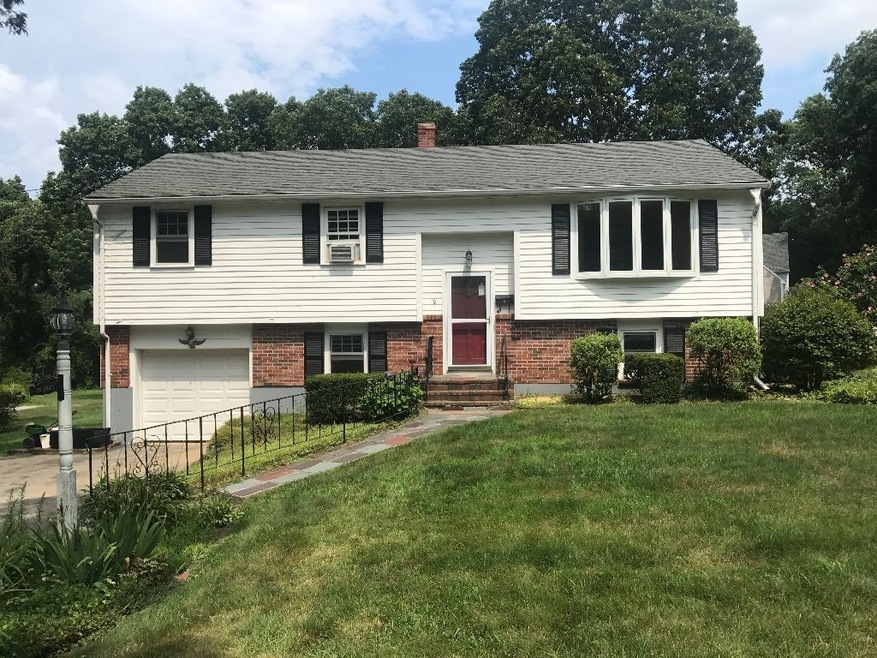
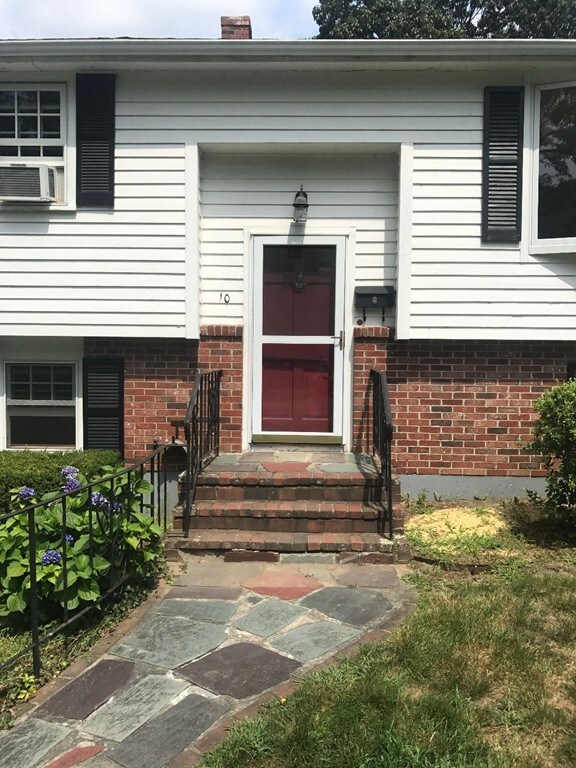

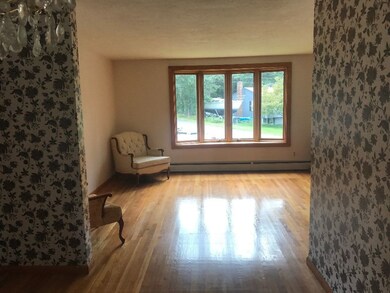
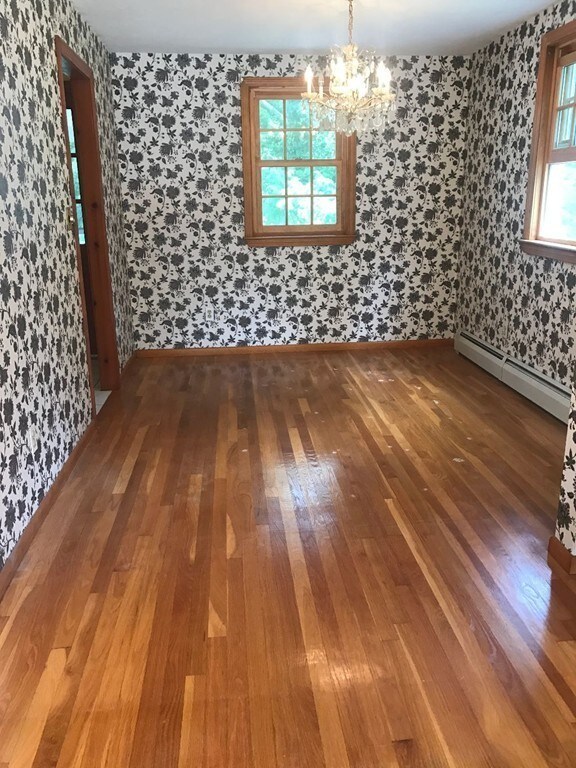
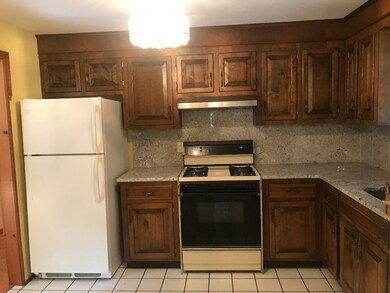
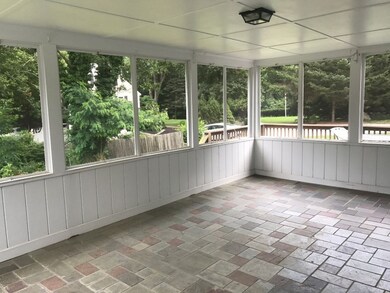
PRICE REDUCTION! A commuter's dream! Charming raised ranch with tons of potential in a great family neighborhood. "Steps" to the commuter rail, walk to downtown and the harbor also close proximity to Nantasket Beach, World's End, Hingham Shipyard with commuter boat to Boston and all that Hingham has to offer. The main floor features bright living room with bay window, formal dining room, kitchen with large 3 season porch (easily converted to year round room), 3 bedrooms and a full bathroom. The partially finished lower level with roughed-in full bath and cedar closet is a blank slate that could be utilized for a playroom, family room, in-law possibility or additional bedrooms. Other features include a one car attached garage, hardwood floors, newer windows, and new granite countertops. With some work, this home has amazing possibilities! **Update - Title V in hand!
Last Agent to Sell the Property
William Raveis R.E. & Home Services Listed on: 08/07/2019

| Date | Type | Sale Price | Title Company |
|---|---|---|---|
| Not Resolvable | $840,000 | None Available | |
| Not Resolvable | $525,000 | -- | |
| Deed | -- | -- |
| Date | Status | Loan Amount | Loan Type |
|---|---|---|---|
| Open | $390,000 | New Conventional | |
| Previous Owner | $20,000 | No Value Available |
| Date | Event | Price | Change | Sq Ft Price |
|---|---|---|---|---|
| 08/24/2020 08/24/20 | Sold | $840,000 | -3.3% | $378 / Sq Ft |
| 07/15/2020 07/15/20 | Pending | -- | -- | -- |
| 06/26/2020 06/26/20 | Price Changed | $869,000 | -2.2% | $391 / Sq Ft |
| 06/18/2020 06/18/20 | For Sale | $889,000 | +69.3% | $400 / Sq Ft |
| 11/26/2019 11/26/19 | Sold | $525,000 | -6.1% | $229 / Sq Ft |
| 10/23/2019 10/23/19 | Pending | -- | -- | -- |
| 10/16/2019 10/16/19 | Price Changed | $559,000 | -2.8% | $244 / Sq Ft |
| 08/07/2019 08/07/19 | For Sale | $575,000 | -- | $251 / Sq Ft |
| Year | Tax Paid | Tax Assessment Tax Assessment Total Assessment is a certain percentage of the fair market value that is determined by local assessors to be the total taxable value of land and additions on the property. | Land | Improvement |
|---|---|---|---|---|
| 2025 | $12,866 | $1,203,600 | $458,300 | $745,300 |
| 2024 | $10,789 | $994,400 | $458,300 | $536,100 |
| 2023 | $9,385 | $938,500 | $458,300 | $480,200 |
| 2022 | $9,374 | $810,900 | $353,800 | $457,100 |
| 2021 | $5,942 | $503,600 | $353,800 | $149,800 |
| 2020 | $6,226 | $540,000 | $353,800 | $186,200 |
| 2019 | $6,054 | $512,600 | $353,800 | $158,800 |
| 2018 | $5,993 | $509,200 | $353,800 | $155,400 |
| 2017 | $6,251 | $510,300 | $361,800 | $148,500 |
| 2016 | $6,346 | $508,100 | $344,600 | $163,500 |
| 2015 | $6,150 | $490,800 | $328,300 | $162,500 |
R
Seller's Agent in 2020
Richard Hirtle
Hart Realty
2 Total Sales
C
Buyer's Agent in 2020
Charles King
Real Broker MA, LLC
(713) 859-5450
224 Total Sales
T
Seller's Agent in 2019
Terri Benoit
William Raveis R.E. & Home Services
(781) 740-1691
15 Total Sales
Source: MLS Property Information Network (MLS PIN)
MLS Number: 72546379
APN: HING-000052-000000-000048
Disclaimer: Certain information contained herein is derived from information provided by parties other than Homes.com. All information provided is deemed reliable, but is not guaranteed to be accurate and should be independently verified.
![]() The property listing data and information, or the Images, set forth herein were provided to MLS Property Information Network, Inc. from third party sources, including sellers, lessors and public records, and were compiled by MLS Property Information Network, Inc. The property listing data and information, and the Images, are for the personal, non-commercial use of consumers having a good faith interest in purchasing or leasing listed properties of the type displayed to them and may not be used for any purpose other than to identify prospective properties which such consumers may have a good faith interest in purchasing or leasing. MLS Property Information Network, Inc. and its subscribers disclaim any and all representations and warranties as to the accuracy of the property listing data and information, or as to the accuracy of any of the Images, set forth herein.
The property listing data and information, or the Images, set forth herein were provided to MLS Property Information Network, Inc. from third party sources, including sellers, lessors and public records, and were compiled by MLS Property Information Network, Inc. The property listing data and information, and the Images, are for the personal, non-commercial use of consumers having a good faith interest in purchasing or leasing listed properties of the type displayed to them and may not be used for any purpose other than to identify prospective properties which such consumers may have a good faith interest in purchasing or leasing. MLS Property Information Network, Inc. and its subscribers disclaim any and all representations and warranties as to the accuracy of the property listing data and information, or as to the accuracy of any of the Images, set forth herein.