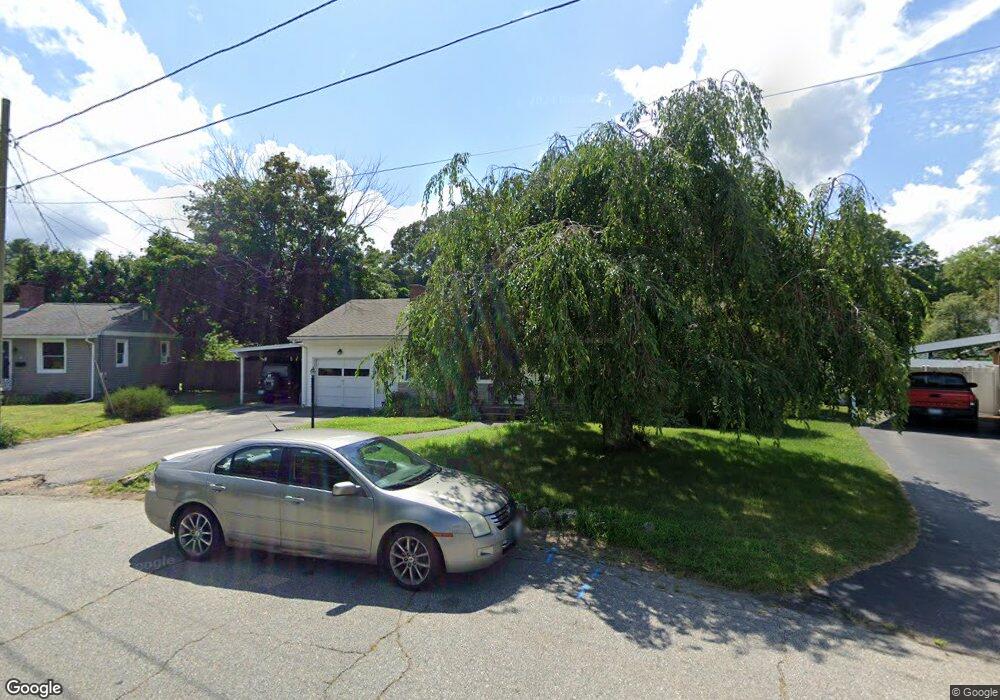
10 Woburn St Coventry, RI 02816
Estimated Value: $382,899 - $418,000
2
Beds
1
Bath
1,872
Sq Ft
$214/Sq Ft
Est. Value
About This Home
This home is located at 10 Woburn St, Coventry, RI 02816 and is currently estimated at $400,725, approximately $214 per square foot. 10 Woburn St is a home located in Kent County with nearby schools including Alan Shawn Feinstein Ms Of Cov, Coventry High School, and Father John V. Doyle School.
Ownership History
Date
Name
Owned For
Owner Type
Purchase Details
Closed on
Sep 2, 2022
Sold by
Powers Alice M
Bought by
Powers Kelly R and Powers Kelly P
Current Estimated Value
Home Financials for this Owner
Home Financials are based on the most recent Mortgage that was taken out on this home.
Original Mortgage
$240,000
Outstanding Balance
$228,261
Interest Rate
5.54%
Mortgage Type
Purchase Money Mortgage
Estimated Equity
$172,464
Purchase Details
Closed on
Sep 26, 2008
Sold by
Powers Kelly R
Bought by
Powers Alice M
Home Financials for this Owner
Home Financials are based on the most recent Mortgage that was taken out on this home.
Original Mortgage
$224,167
Interest Rate
6.57%
Purchase Details
Closed on
Feb 26, 1999
Sold by
Garand Michael R and Garand Cathy A
Bought by
Powers Kelly R
Create a Home Valuation Report for This Property
The Home Valuation Report is an in-depth analysis detailing your home's value as well as a comparison with similar homes in the area
Purchase History
| Date | Buyer | Sale Price | Title Company |
|---|---|---|---|
| Powers Kelly R | $300,000 | None Available | |
| Powers Alice M | $235,000 | -- | |
| Powers Kelly R | $246,000 | -- | |
| Powers Kelly R | $123,000 | -- |
Source: Public Records
Mortgage History
| Date | Status | Borrower | Loan Amount |
|---|---|---|---|
| Open | Powers Kelly R | $240,000 | |
| Previous Owner | Powers Kelly R | $100,000 | |
| Previous Owner | Powers Kelly R | $224,167 | |
| Previous Owner | Powers Kelly R | $35,000 |
Source: Public Records
Tax History
| Year | Tax Paid | Tax Assessment Tax Assessment Total Assessment is a certain percentage of the fair market value that is determined by local assessors to be the total taxable value of land and additions on the property. | Land | Improvement |
|---|---|---|---|---|
| 2025 | $4,491 | $279,100 | $93,900 | $185,200 |
| 2024 | $4,421 | $279,100 | $93,900 | $185,200 |
| 2023 | $4,279 | $279,100 | $93,900 | $185,200 |
| 2022 | $4,256 | $217,500 | $87,200 | $130,300 |
| 2021 | $4,220 | $217,500 | $87,200 | $130,300 |
| 2020 | $4,837 | $217,500 | $87,200 | $130,300 |
| 2019 | $4,192 | $188,500 | $74,000 | $114,500 |
| 2018 | $4,073 | $188,500 | $74,000 | $114,500 |
| 2017 | $3,955 | $188,500 | $74,000 | $114,500 |
| 2016 | $3,560 | $166,300 | $60,200 | $106,100 |
| 2015 | $3,464 | $166,300 | $60,200 | $106,100 |
| 2014 | $3,392 | $166,300 | $60,200 | $106,100 |
| 2013 | $3,680 | $197,200 | $89,900 | $107,300 |
Source: Public Records
Map
Nearby Homes
- 140 S Main St
- 86 Wood St
- 5 Woodland Ave
- 18 S Main St
- 1152 Main St Unit 1154
- 252 S Main St
- 1268 Main St
- 33 Holden St Unit 35
- 33-35 Holden St
- 37 Holden St
- 45 Pine Ave Unit 36
- 22 Colorado St
- 20 Pine Way Blvd
- 19 Pine Way Blvd
- 77 Lear Dr
- 1 O'Hare Ct
- 24 Linwood Dr
- 53 Lear Dr
- 38 Torch Ln
- 173 Hopkins Hill Rd
Your Personal Tour Guide
Ask me questions while you tour the home.