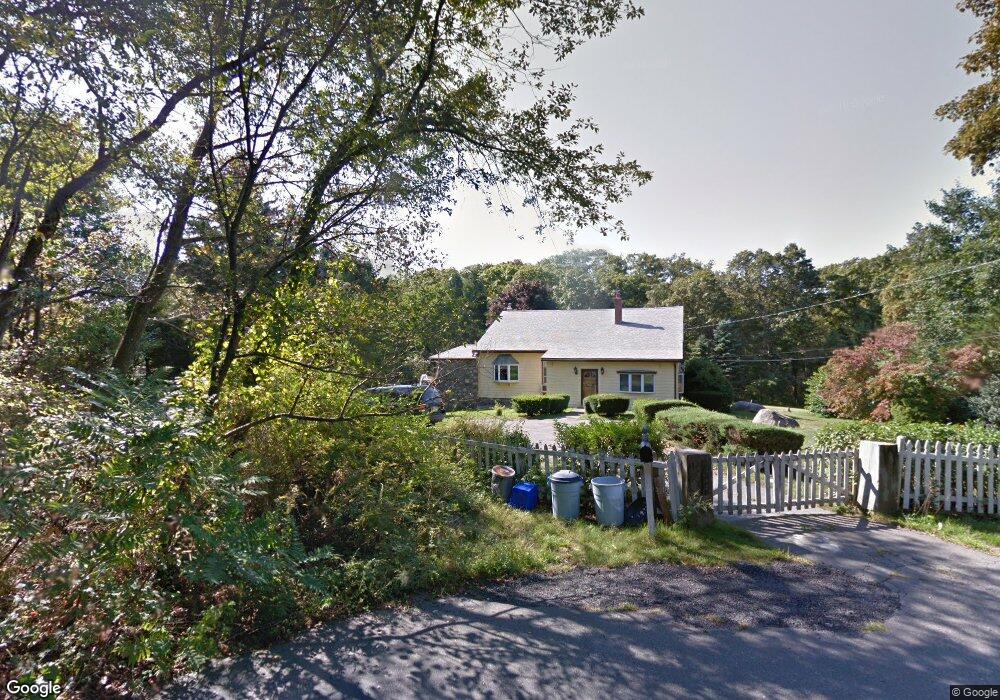
10 Wyman Ave Salem, MA 01970
Highland Avenue NeighborhoodEstimated Value: $999,000 - $1,195,000
3
Beds
3
Baths
3,998
Sq Ft
$266/Sq Ft
Est. Value
About This Home
This home is located at 10 Wyman Ave, Salem, MA 01970 and is currently estimated at $1,063,256, approximately $265 per square foot. 10 Wyman Ave is a home located in Essex County with nearby schools including Horace Mann Laboratory, Witchcraft Heights Elementary School, and Saltonstall School.
Ownership History
Date
Name
Owned For
Owner Type
Purchase Details
Closed on
Oct 17, 2003
Sold by
Salem City
Bought by
Oleary John P and Oleary Tracey S
Current Estimated Value
Home Financials for this Owner
Home Financials are based on the most recent Mortgage that was taken out on this home.
Original Mortgage
$67,200
Outstanding Balance
$31,832
Interest Rate
6.43%
Mortgage Type
Purchase Money Mortgage
Estimated Equity
$1,031,424
Create a Home Valuation Report for This Property
The Home Valuation Report is an in-depth analysis detailing your home's value as well as a comparison with similar homes in the area
Home Values in the Area
Average Home Value in this Area
Purchase History
| Date | Buyer | Sale Price | Title Company |
|---|---|---|---|
| Oleary John P | $96,000 | -- | |
| Oleary John P | $96,000 | -- |
Source: Public Records
Mortgage History
| Date | Status | Borrower | Loan Amount |
|---|---|---|---|
| Open | Oleary John P | $67,200 | |
| Closed | Oleary John P | $67,200 |
Source: Public Records
Tax History Compared to Growth
Tax History
| Year | Tax Paid | Tax Assessment Tax Assessment Total Assessment is a certain percentage of the fair market value that is determined by local assessors to be the total taxable value of land and additions on the property. | Land | Improvement |
|---|---|---|---|---|
| 2025 | $9,878 | $871,100 | $222,700 | $648,400 |
| 2024 | $9,632 | $828,900 | $222,600 | $606,300 |
| 2023 | $9,162 | $732,400 | $203,800 | $528,600 |
| 2022 | $8,565 | $646,400 | $176,800 | $469,600 |
| 2021 | $8,813 | $638,600 | $176,800 | $461,800 |
| 2020 | $8,828 | $610,900 | $166,700 | $444,200 |
| 2019 | $8,388 | $555,500 | $141,100 | $414,400 |
| 2018 | $8,167 | $531,000 | $134,500 | $396,500 |
| 2017 | $8,076 | $509,200 | $127,300 | $381,900 |
| 2016 | $7,744 | $494,200 | $112,300 | $381,900 |
| 2015 | -- | $439,400 | $103,300 | $336,100 |
Source: Public Records
Map
Nearby Homes
- 8 Wyman Ave
- 26 Manson St
- 12 Tanglewood Ln Unit 12
- 15 Monte Rd
- 25 Monte Rd
- 17 Lions Ln
- 62 Fays Ave
- 6 Countryside Ln Unit 1303
- 44 Valley Rd
- 112 Fays Ave
- 9 Sampson Ave
- 2 Sophia Rd
- 150 Windsor Ave
- 122 Bickford St
- 16 Appleby Rd
- 37 Arbor St
- 52 E Park Ave
- 54 Cavendish Cir
- 25 E Park Ave
- 16 Admirals Ln Unit 16